Showing posts with label eco slowdown. Show all posts

Friday, February 20, 2026

World eco recovery fizzles

 World industrial production is slowing.  Again, the same pattern keeps on showing up:  recovery beginning in 2024, but fizzling out in 2025.


I've already talked about slowing Chinese IP; but the US has also slowed, though by less, because of the tariff debâcle.  There are tentative signs the US economy mat finally be accelerating again.


As usual, click on the charts to see a clearer image.

Friday, January 9, 2026

Big 8 soggy

The chart below shows the purchasing managers' index (PMI) for the big 8 economies/regions (US, Euro Area, China, Japan, UK, Brazil, Russia, India), which make up just over 50% of the world's GDP.  The blue dotted line is for manufacturing, the red dotted line for services, and the green line is the average of the other two.

The service PMI is improving, but the manufacturing PMI is weakening enough that the average is sliding.

The conclusions are pretty much the same as for the other indicators we've looked at recently: a faltering recovery, though not yet recession, but certainly stagnation.  The US's index is levelling off, the UK's drifting higher, Russia's and China's also fractionally better, Japan's is flat, India's has slowed a lot since July, Europe's is weakening.  So, a mixed result, consistent with stagnation rather than slump.  That may change as new data emerge, and I think the risks lie to the downside. 


Another US indicator slides

 Another window into what's really happening in the economy is the relatively new logistics managers index.  The chart below shows a three-month moving average of the logistics index compared with the average of the extreme-adjusted manufacturing PMI and ISM.  The logistics index has been falling since February.

The conclusions are obvious.


Monday, December 1, 2025

A very clear slowdown in China

A very clear slowdown.  (See China's manufacturing PMI heads south

Europe is (more or less) still recovering, though I would not describe it as a runaway boom. 

But the US is sliding.   Plus, China's slowdown is forcing the country to export deflation as her industry tries to survive the domestic crunch.

Quelle pagaille !  Trump's tariff tango is endangering the world economy.   The world's two largest economies are at best stagnating.  And the trends don't look good. 


[Technical note:  Most Chinese economic time series are affected by the peripatetic Chinese New Year, which can be in January or February.  The NBS (National Bureau of Statistics)  often does not publish data for January and February, or publishes an average for the two months.

Seasonally adjusting these time series is difficult.  This is complicated further by China's publishing industrial production as a year-on-year change, not as an index.  Estimating an index was made more tricky by successive Covid lockdowns.  I have found that my seasonal adjustment program was not completely removing seasonality because of these problems.  

So I have adjusted somewhat the method of calculation for Chinese IP, by seasonally adjusting my estimated IP index before and after covid separately.  In addition, I have fitted a centred 12-month moving average to the resulting time series.  By definition, a 12-month moving average contains no seasonality.  The rate of change I show is calculated from the average of my seasonally adjusted index and its 12-month centred moving average.  I hope this still leaves enough variation to detect change in business cycle trends, without being misled by spurious seasonality.] 

Thursday, June 12, 2025

Credit is tightening

If credit is tightened, this ultimately leads to an economic downturn.  The chart below shows whether large and medium-sized banks are tightening lending.  Because when credit is tightened, the economy slows, and vice versa, it is plotted inversely, and because it only affects the economy with a lag, it has been plotted with a nine-month lag.  So, the rise in the number of banks tightening credit since Q3 last year will be reflected in a fall in economic activity in Q3 this year, and has been plotted accordingly.  The economy should start to decline from next month, and this should start showing up in more than just shorter-leading indicators like the ISM and PMI and regional Fed surveys, such as employment, GDP, retail sales, etc.

Note how an external (exogenous) event, the Covid pandemic, affected the lags.  

I don't use the credit tightening indicator in my US leading index, because it is quarterly, so it is an additional independent pointer towards an imminent recession.


Sunday, August 4, 2024

July labour stats in the USA

 I talked about the blip in the US PMI/ISM data here.

These charts show the labour force data.  The first one shows the change in payrolls, the second (from a different survey), the change in the unemployment rate (inverted, because unemployment goes up in recessions and down in recoveries)  In each chart, they are compared with the average of the manufacturing and services ISM surveys, extreme-adjusted.

You can clearly see the post-covid economic recovery in 2021, and then the gradual subsidence as fiscal stimulus wears off, high interest rates take effect, and the post-covid "revenge buying" in services slows.

Will the US go back into recession?  I don't think it will, because recessions occur when there is excess---excess debt, excess inflation, a property crisis, fierce response by central banks, a collapse in consumer and/or business confidence.  But it's relatively easy for slowdowns to happen.   In an uptrend, the economy can advance more or less rapidly, producing mini-cycles.  In recessions, mini-cycles are much rarer.  When the economy plunges, it doesn't pause to take its breath.  

The bottom chart shows the rate of change in my own US leading index, designed to give forward indication of changes in direction in the economy, compared with the year-on-year change in real GDP.   As you can see, the rise in the rate of change of the leading index should be consistent with a rise in GDP growth.  And it is.  Although it is showing a small downturn, indicating a slowing in GDP growth in 2025, it's not pointing towards an imminent recession.  

But my leading index doesn't include any measures of fiscal stimulus.  And that is tailing off:  if you look at the change in the Federal deficit, the IRA led to a big increase in the deficit in 2022, and a modest retracement in 2023.   That would have provided fiscal stimulus in 2022, and fiscal contraction in 2023.  Enough to cause a recession?  No.  But enough to take the shine off the growth numbers.

So, not a recession, but very likely a sluggish recovery, with a short-term blip.


Saturday, August 3, 2024

Worrying slide in world PMI in July

 We now have most of the manufacturing PMIs for the world for July.  (Services PMIs out next week).  

There has been a worrying decline in July, almost all of it in the USA, echoed by July's labour force data.  China has also been weak, which I talked about here.  

Economic time series do not always move in straight lines.  For example, in 2013, as the world was recovering from the Euro crisis, there was a 4-month period when the Big 8 manufacturing PMI fell.  At the peak in 2010, the Big 8 PMI apparently peaked in 2010, before going on to achieve an even higher reading in 2011.  So blips in an up or down trend do happen.

What causes recessions is major monetary and credit imbalances.  Slowdowns are different.  Economies don't grow in a straight line.  There are small waves within the big ones.  

So the key question is whether this is just a small wave in the USA, or the start of something much bigger.   

The Fed's tightening has been extreme.  Biden's IRA provided a massive fiscal stimulus, but that is fading (I'll explain how fiscal stimulus works one of these days).  The fiscal stimulus, and the "revenge spending" in services, helped mask the negative effects of the Fed's tightening and the swingeing cuts in liquidity they imposed.  So is the very recent weakening due to the delayed impact of the Fed's tightening of monetary policy?  Because it can't be anything else:  inflation is trending lower; there's no credit crisis; there's no collapse in consumer confidence.  (I will update my US indicators shortly.)

I think the sudden tumble is just a blip.  But I may be wrong; I have been before.  Again, though, I reiterate:  this global economic recovery will not be vigorous.

The Fed will start cutting rates in September.  It may regret not doing it sooner.


Thursday, July 18, 2024

China likely to slow further

The chart below shows the year-on-year percentage change in my leading and my coinciding indices for China.  The leading index has been lagged (= plotted forward) by 9 months, so it suggests that the Chinese economy will continue to slow into 2025. 

Exactly how big China is in the context of the world economy is unclear, since official GDP data overstate its size.  It is prolly around 15% of world GDP, but is much more important in commodities, where it is responsible for perhaps half of world minerals demand.


Saturday, December 31, 2022

What on earth is happening in China?


From The Age


China’s lurch from extreme zero-Covid to extreme herd immunity is a watershed moment in the global ideological struggle of our age, an unanswerable illustration of why autocratic regimes are less successful in the end than messy liberal democracies.

Leadership cults and totalitarian media control can at times enable breathtakingly destructive policies, and it is hard to think of a policy more unhinged than suddenly exposing a “naive” population with inadequate vaccination to mass infection in mid-winter, and just before the great internal migration of Chinese New Year.

What was the purpose of lockdown torment - and the economic slippage that came with it - a full 18 months after the rest of the world had reopened and moved on?

Most regional governments are suppressing COVID data but Zhejiang province south of Shanghai, with a population the size of England, says it faces a million new cases a day. It expects the figure to double again this week. Sichuan is in the eye of the storm already.

China’s National Health Commission fears that up to 37 million people a day are being infected and that 248 million caught the virus over the first 20 days of December, according to leaked but unverified minutes posted online.

To the extent that successful COVID management has been mobilised over the last three years in the beauty contest of the new cold war, this portends a public relations disaster for China’s authoritarian model. The breakdown of the Chinese hospital system cannot be hidden. To rub salt in the wound, wealthy Chinese have been converging on Macau in search of a Western mRNA vaccine.

President Xi Jinping brooks no questioning of his policy pirouettes from within the Communist elites. “We should resolutely toe the Party’s line. We must never deviate from the notes,” he told the Politburo at a “self-criticism” session this week, a Maoist practice back in vogue.

The Party’s briefing “notes” in this episode state that dynamic zero-Covid was an unqualified success and demonstrated the superiority of China’s Communist system over the feckless and immoral West, but that it can now be cast aside because omicron is “just like the flu”.

This is scientific malpractice and the Chinese authorities know it. A high-powered US study by Johns Hopkins University found that the risk of severe disease or death from omicron was “similar to ancestral lineages” (other than delta) among those either unvaccinated or never exposed to the disease.

This would include the original Wuhan strain but also the Kent variant that killed large numbers in the UK’s second wave just as the vaccine rollout was starting.

A new preprint from Queensland’s Berghofer Institute says omicron’s BA.5 sub-lineage attacks the brain and “shows increased neurovirulence compared to earlier omicron sub-variants” in mice. It is not yet reproduced in human studies.

To throw open the borders at this moment and disgorge planeloads of infected travellers on the world comes close to a hostile act, given the known risk of new variants arising. Tests found that 62 of the 120 passengers on a flight from Beijing to Milan on Dec 26 were positive.

The British Government is taking a major gamble by letting in any flights from China at a time when the National Health Service is already stretched and at the peak of the viral season. This has echoes of those first fatal weeks of insouciance after the Wuhan outbreak in early 2020.

The astounding feature of China’s big bang reopening is the near-total lack of preparation. The regime has gone overnight from welding people into their apartment blocks to stamp out a single urban case, to the opposite absurdity of compelling infected workers to return to the factory floor for the higher cause of GDP.

Little was done in advance to plug the vaccination gaps. As of mid-December, almost a quarter of the over-80s had never had a single jab. A third of the over-60s had the original two doses of patriotic vaccines but no booster. None has received Western vaccines with better efficacy and cell memory, even as part of a mix and match.

“If China had said that zero-Covid was only a temporary measure to buy time until people got vaccinated, and communicated the policy accordingly, they would be in a far better position right now,” said Prof Ben Cowling from Hong Kong University in an analysis for The Lancet.

But Xi’s government did not do so. It claimed instead to have defeated the virus by tracking every infection with omnipotent surveillance. It led people to think that vaccination was not necessary. China has just 3.6 intensive care beds per 100,000 people, compared to 34 in America, or 29 in Germany. The ratio of nurses is a quarter of Western levels. The regime has spent heavily on testing, isolation camps, and quarantine facilities - mostly useless at this point - and neglected the hospitals.

Fifteen years ago, I attended a panel session in Davos with a leading Chinese demographer who predicted that his country’s ageing crisis would prove so overwhelming that the elderly would be sent onto the ice to die - figuratively speaking, he meant mass euthanasia.

Let us hope that we are not seeing this Darwinian cull in action. Consultants Airfinity concluded last month that 1.3 million to 2.1 million could die, but that was based on maximum infections of 279 million. Feng Zijian, ex-deputy director of China’s Centre for Disease Control, thinks infections are more likely to top 800 million, or 60 per cent of the population.

Whatever the grim tally, the coming weeks are going to change the world’s view of Xi’s China, and it coincides with a change in economic perception: global opinion has stopped believing in the fairy tale of Chinese perma-growth. The fence-sitters of the international system - what we used to call non-aligned countries - no longer think it quite so inevitable that China will displace the US as economic and regulatory hegemon by mid-century. The Saudis may be raising their geopolitical bets on China, but others are quietly hedging.

The economic rot set in before Xi. The Party leadership misread the Lehman crisis of 2008, supposing it to be a fundamental crisis of American laissez-faire capitalism and a vindication of state-directed Leninist capitalism. But it was China that suffered the deeper damage. The effect was to side-line reformers warning that China would slip into the middle income trap if it clung too long to an exhausted catch-up model.

Xi has finished the job, more or less guaranteeing the collapse in China’s growth rate by subjecting the productive part of the economy to the same sledgehammer methods used against COVID.

His assault on tech companies and private enterprise - installing party commissars at every level of management - is systematically undermining the market dynamism nurtured by Deng Xiaoping 40 years ago. But such is the logic of a totalitarian party that lives chiefly for its own perpetuation. It cannot give up the state-owned industrial behemoths that serve as a patronage machine for the cadres and a lever of political control; nor can it allow commercial fiefdoms such as Jack Ma’s Alibaba to emerge as a rival centres of power.

It has been a bad year for China and for the alliance of autocracies. Iran is beyond the point of pre-insurrection. Russia has been exposed as a second-rate military power with a deranged political culture. The West has shown the long-reach of its economic, financial, and maritime power - almost irresistible when the whole G7 acts unison - and has shown the superiority of its military technology and signals intelligence. Oppose that if you dare.

Was Francis Fukuyama so wrong after all in The End of History? Liberal democracy may not be the end state of human political progress, but it may well have more staying power than the dictatorships this century.


Observe how, until the GFC (2008/2009), growth was accelerating,
and how since then it's been decelerating.
Note also the Covid plunge in 2020, and, an artefact of the year-on-year calculation,
the 2021 spike.


Thursday, December 1, 2022

Australia's PMI falls in November. Again.

 Australia's PMI, calculated by S&P Global, declined again in November.  It's still above the "recession line" of 50%, but the trend is obvious.  And of course, the global economy is sliding (lower chart) and Australia's Central Bank, the Reserve Bank of Australia, has been raising interest rates.  


Tuesday, October 25, 2022

US "flash" PMI falls sharply

 The USA is the last of the countries for which S&P Global produces a preliminary estimate of the latest month's PMIs,   It fell, and is now below the 50% "recession line".  


I can't calculate a preliminary Big 8 PMI for October, because S&P Global only produces a preliminary ("flash") PMI for the USA, UK, Europe, Japan and Australia.  But the "Big 4" is well correlated with the Big 8.  It's obvious that the world economy slowed again in October.  We'll see what the data for the other big 8 economies (China, Russia, India and Brazil) show.


Monday, October 24, 2022

Commodity prices to fall further

 It's obvious that commodity prices, as measured by the CRB index, have peaked.  Commodity prices follow the world growth rate, though of course there are obviously other factors, such as war, droughts or boycotts, which help nudge prices higher at times.  

The chart below shows my world diffusion index, which measures the percentage of monitored times series rising.   At zero, all series are falling, at 50% half are rising, and at 100% all are rising.  My world diffusion index monitors up to 303 time series, covering a wide range of different activities for most countries in the world.  It is not weighted by country GDP, unlike, for example, my calculation of the Big 8 PMI or industrial production.   

In my judgement, world economic activity is going to continue to slow, and so world commodity prices on average will too.  "On average" is a key qualification.  Some commodities, such as lithium, are still rising.  But oil and gas are falling, despite supply constraints, though the declines are not yet precipitous.


Japan PMI slips in October

 Just a quick chart to keep you updated.  A modest (0.1 per cent) fall in Japan's preliminary ("flash") manufacturing PMI in October.  The chart shows the extreme-adjusted and smoothed series for Japan.  Trend still down, now only a whisker above the 50% recession line.


Wednesday, October 19, 2022

My tweaked "medium" US leading index

In this report, I commented that definitional changes to US money supply data caused a huge jump in M1, which was so large it distorted my leading indices for the US.   I tweaked my "medium" leading index by removing M1 for months when it was distorted, and the spike in the index in 2021 was reduced, though it still rose sharply as fiscal and monetary stimulus during and after the Covid Crash was substantial.

The updated chart with the revised leading index is shown below.  While my "medium" leading index suggests a slowdown, it doesn't yet point to a deep recession, which, nevertheless, I think very likely.

See previous chart/index here.

Saturday, October 15, 2022

US core inflation remains elevated

Until core inflation (which excludes the direct impact of oil and food prices) falls back to its 2 percent target, the Fed is unlikely to stop raising rates.  The core inflation rate must be lower on a sustained basis before the Fed will relax its vigilance.  Unfortunately, to reduce inflation, they need to reduce growth.  And this growth/inflation trade-off has worsened because of Covid's effect on supply chains and the labour force. 

Not good for asset prices, or for world growth.


Wednesday, October 12, 2022

"Medium" leading index points to 12 months of decline.

 I have three US leading indices.  A "short" one, which leads by 3 months, but sometimes by a bit more.  A "long" one, which leads by 18-24 months, giving you long advance warning of recessions.  And a--for want of a better word--"medium" leading index, which leads the business cycle by ±12 months.  In the chart below, this-"medium" leading index is plotted with a 12-month lag against my US QCI, which is a monthly proxy for quarterly GDP.   (It's not a perfect fit with GDP, but the fit is surprisingly close.    The QCI is an unweighted average of industrial production, retail sales volume, and payrolls employment.)  Relative to trend,  the QCI/GDP has prolly peaked.

The leading index is distorted by the Fed's change in regulations about interest-bearing accounts, which affected the measurement of money supply.  The rise in the leading index in 2021 is therefore prolly overstated.

So far, the "medium"-leading index suggests a downturn, but not a deep one.  But if you reduce the peak in the leading index for the distorted money supply data, the low is the leading index must also be reduced.  I'm doing a bit of research on the money supply data, and also on the leading index if we leave out money supply. [Update: 19/10/22 See updated chart here]

As usual, data have been extreme-adjusted by the Bureau of Census's algorithm (my program)


Saturday, October 8, 2022

US labour mkt: Fed tightening to continue

Over the last week or so, the financial markets have worked themselves into a tizzy about how the Fed is going to "pivot", and stop raising rates.  Share prices rose, the US dollar fell, bond yields fell.  

But the labour market data out Friday morning US time ended this brief burst of euphoria.  Actually, it was never terribly plausible that the Fed was going to "pivot".   The Fed will prolly not stop raising rates until core inflation has fallen from the current 7-ish per cent to much closer to 2 per cent.  Inflation is a lagging indicator.  It responds to economic activity with a one-year lag, though the lag can vary.  So, even if core inflation peaks, it's not likely to get back to the Fed's target until the economic growth has actually gone negative, or at least, fallen a lot.  In other words, job growth needs to be low or zero or even negative.  And that hasn't happened yet.  Job growth (smoothed out) is still above 350,000 per month.  

Because the real economy lags monetary policy changes, the risk remains very high that the Fed will over-tighten and push the economy into a recession while it tries to push the inflation genie back into its bottle.  


Friday, October 7, 2022

Big 8 & Small 6 all trending south

 I talked about the Big 8 and the Small 6 when I first introduced the concept, here.

Both indices continue to decline.  The global business cycle continues to slow.


Tuesday, October 4, 2022

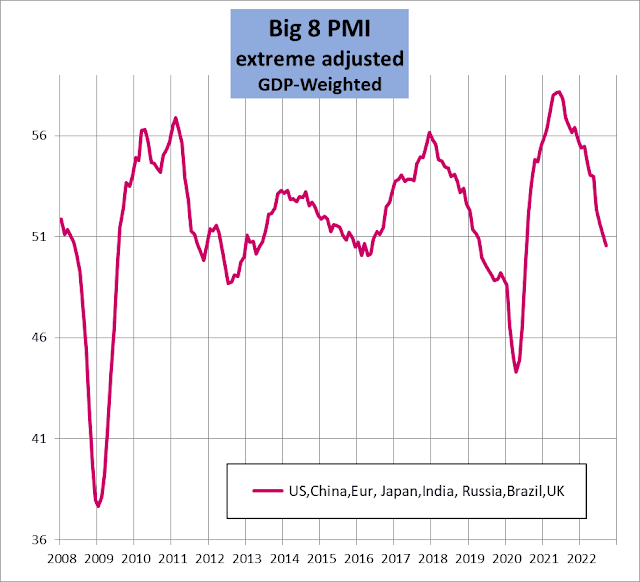
Big 8 PMI slips again in September

The Big-8 average PMI is a GDP-weighted average of the PMIs for the USA, UK, Europe, China, Japan, Russia, Brazil and India.  Each one is individually extreme-adjusted before the results are added up to give the total for the 'Big 8'.

Clearly, the slide continues.  At 50.5, the Big 8 PMI is only 0.5% above the 50% recession line.


US econ continues to slow.

The average of the extreme-adjusted PMI and ISM for the US continues to slide.   As always, the green line in the chart is the one to watch. The economy is still growing, but its growth rate is clearly slowing.  I expect the recession will begin in November or December.