Showing posts with label wind power. Show all posts

Sunday, November 17, 2024

45 years on: first wind turbine still going

Those around in the late 1970s may remember seeing magazine photographs of Danish students and volunteers carrying a massive wind turbine blade out of a tent (see Figure 13). (Karnøe and Garud, 2012; Tvindkraft, n.d.). That photo captured the world’s imagination. It was one of those rare historical moments that became a beacon to citizens everywhere who wanted to develop renewable energy by themselves, for themselves, and for their community’s benefit.

Figure 13. Tvind people power. The photo seen around the world in 1978 as students at the Tvind School carry one of the wind turbine blades from its assembly hall to the wind turbine. The action sent a political message: Together we are strong. We want wind power and we will build it ourselves. (Tvind School).


They were not ordinary students. They were on a mission and they knew at the time they were undertaking an historic task. They had set out to prove to the Danish government that Denmark didn’t need nuclear power, that Denmark with its long history of working with the wind could once again do so. They made another message clear too. If the Danish government wouldn’t act, the people would take the matter into their own hands, as they were doing that historic day, and build their own wind turbines.

Tvind was not an ordinary school either. Located near Ulfborg on the windy west coast of Denmark’s Jutland peninsula, the Tvind School was unlike a school in the modern sense and more in the tradition of the Danish folkehøjskole movement founded in the mid-19th century by Danish theologian N.F.S. Grundtvig. It was more like the training school founded by Poul La Cour at Askov than a public school. Not surprisingly, Tvind has had a similar influence on the development of wind energy in the contemporary era as the folkehøjskole at Askov had at the turn of the 19th century.

In the retelling of the modern wind industry’s early history, the construction of the wind turbine by Tvind and its role in pioneering modern wind turbine blades is often overlooked. It’s an uncomfortable story for many still, because the implications are so profound. How could a group of students, their teachers, and volunteers accomplish what some of the world’s most sophisticated aerospace firms with millions in research money could not? How could they build what was then the world’s largest wind turbine—a machine that has operated for more than three decades and remains in service to this day—when Boeing, Westinghouse, General Electric, Hamilton Standard, Kaman, Messerschmidt-Bölkow-Blohm, MAN and others had all failed, their turbines dismantled and sold for scrap?

The work at Tvind was taking place at the same time as NASA was developing its Mod-0A series and GE’s subsequent Mod-1. The difference in outcomes couldn’t have been starker.

The message delivered by the Tvind School so long ago was that wind energy was too important to be left to aerospace giants, electric utilities, and even to national governments. They demonstrated that unlike nuclear power, which requires massive centralized institutions, wind turbines could be built and owned by common citizens. This is a message that still resonates today.
Of course, the Tvind design team had sophisticated engineering knowledge. They and their faculty were not the Luddites some have portrayed. The school received valuable technical assistance from Helge Petersen and others from what would become Risø’s test station for wind turbines and from the Danish Technical University, for example. This was beneficial to all parties. Tvind was able to deal with some thorny technical problems, while the technical establishment gained valuable experience and hands-on knowledge of a large wind turbine outside the official Danish wind program.

And yes, they built upon a long Danish tradition with wind energy. But they were also willing to depart from that tradition when necessary. After all, they set out to build the first Danish wind turbine using long cantilevered blades instead of a rotor braced with the struts and stays like Juul had used at Gedser. They intended to build what was then considered a “modern” turbine, one that used cantilevered blades mounted downwind of the tower. Just as importantly, they were also willing to borrow good ideas from others, including from their southern neighbor, Germany. It was in this that they made their most significant technical contribution.

Tvind studiously avoided the common affliction that infects most design teams—the Not-Invented-Here syndrome. There’s a natural human tendency to want to go it alone, to be the sole inventor of a new idea and to discount the work of others and ignore the lessons they learned—often at great expense.

To build a long cantilevered blade the Tvind design team knew they needed a strong attachment at the blade’s root. Only a few decades earlier, Hütter had demonstrated just how to do so. Tvind’s development team adopted the concept as its own. The blades the Tvind team were building were no ordinary blades. They were big, each was 27 m long—as long as the blade that failed on the Smith-Putnam turbine in 1945. And massive, each blade weighed 5200 kg. The blades were nearly as big as those being developed at the same time by GE for its unsuccessful Mod-1 turbine.

Figure 14. Tvind blade. The late Preben Maegaard, one of the pioneers in the Danish wind revival, stands by the root end of one of the original Tvind blades. The blade is part of Danmarks Vindkrafthistoriske Samling collection of historic Danish wind turbines and components and can be seen at the Folkecenter for Renewable Energy near Hurup, Denmark. The 27-m long blade weighs 5200 kg. Note the blade flange where it mounts to the hub. The flange and the technique for attaching the fiberglass in the blade to the flange were originally developed by Ulrich Hütter in the 1950s and 1960s. Tvind adapted the technique to its pioneering wind turbine in 1975.


The huge Tvind project was begun in 1975 and finally completed in 1978. At the time it was the largest wind turbine in the world. It hasn’t been all smooth sailing. Out of safety concerns, the original 2 MW design was downgraded to 1 MW and half of this has been used for heating the Tvind school complex because the local grid wasn’t able to take the full 1 MW.

One blade failed in 1993 after 15 years of operation, requiring replacement of the rotor. The turbine was later returned to service and it was still operating in 2021[2024!]. This is a remarkable accomplishment for any wind turbine, and more so for such an early turbine and for one so large.

At the same time as Tvind was building the big wind turbine, a team of students developed an 11-kW downwind turbine using the same blade mounting technology they were using on the large turbine. In the spirit of La Cour, Tvind then made the design of these 4.5 m long blades available to others.

Tvind’s blade design—primarily its use of the Hütter flange—and their willingness to share the technology they had developed with other experimenters was the key element that led to what would become today’s wind industry, say Danish wind historians. All that was missing was someone to commercialize the blade technology (Maegaard et al., 2013).

Figure 15. Tvindkraft. World famous megawatt-scale wind turbine installed by students at the Tvind School near Ulfborg on the west coast of Jutland in 1978. Like other pioneering Danish wind turbines, the Tvind turbine is still operating after more than three decades—long after other large turbines installed during the period had been removed and sold for scrap. The turbine’s striking pop art paint scheme was created in 1999 by architect Jan Utzon to celebrate the turbine’s 25th anniversary. Utzon is the son of the architect who designed the Sydney Opera House.

[Read more here and here]

The rest is history.  

Thanks to these energetic pioneers, who succeeded when all the experts failed, wind, together with solar, will eventually power our grid.  In 2023, their combined total was 13.3% of global electricity generation.  In 2003, that was 0.4%.  That's a compound growth rate a touch under 20% per annum, which, if sustained, will lead to wind and solar reaching 80% of global electricity generation by 2033.  Will that sort of growth rate be sustained?   Who knows?  My guess is yes:  wind, solar, and battery costs continue to decline, while coal and gas get no cheaper.  

But those who twenty years ago mocked renewables because they provided less than half a percent of electricity, will no doubt be saying, I always told you they would work.  

Luckily for the world, these Danish students and professors didn't take no for an answer, and their triumph doesn't just live on in the explosive growth of wind power across the world, but in their turbine, the world's first commercial wind turbine, which is still working today, nearly 50 years later.

Tuesday, May 28, 2024

How many birds do wind farms kill?


From Sustainability By Numbers


Bird species are under threat from climate change.

It would be worrying, then, if a move to low-carbon energy increased pressures on bird populations. That’s a common concern as countries move to wind power.

It’s true: wind turbines do kill birds (and bats). But how many, and are they a bigger threat than other hazards?

In this post, I take a look at estimates of bird deaths from turbines and try to put them in context. I also explore ways that we can reduce them.


How many birds do wind turbines kill?


Measuring bird kills from turbines is hard. An obvious way to do so is to have humans go out and count bird carcasses in the area. Many studies have done that.

The problem is that humans often miss small birds, such as songbirds. That’s where dog searches come in.

The estimates that I found in the literature vary quite a bit. Partly due to measurement challenges, but also because risks vary by location: some areas will be prime hotspots for wildlife while others will be more barren.

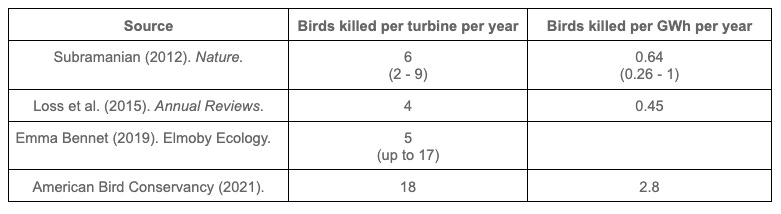
Estimates ranged from 4 to 18 birds killed per turbine per year. More than four times the difference. I’ve detailed some of these studies in the table below.1


Sources: Subramanian (2012); Loss et al. (2015); Emma Bennet (2019); American Bird Conservancy (2021).

The large spread of these estimates isn’t very satisfying, but at least gives us some sense of magnitude. What would this mean for the total number of birds killed each year?

Let’s apply these numbers to the United States (which is where most of the studies came from).

In 2022, the US produced 434 TWh of wind power.2 Taking the numbers above, that gives us a range of 200,000 to 1.2 million. The upper figure seems more likely since it tries to correct for the under-detection of smaller birds. Let’s call it around one million birds per year.

Assume that these risks are the same across the world, and global deaths are probably over 5 million.3


Cats, buildings, and cars kill far more birds than wind power


Around one million birds are killed in the US. Is that a big number?

Not really, compared to other pressures.

The chart below shows estimates of the number of birds killed by different hazards in the US.

You can see that wind turbines kill a few million at most. Cars, buildings, and pesticides kill tens to hundreds of millions each. Cats kill at least a billion.

Do these figures seem credible? I did a bit of a sense check on a few of the numbers below. If you want to follow along, feel free. If not, skip to the next section.


[see the article for detailed discussion of the data.  The author also discusses how any birds are being and will be killed by climate change, and concludes that the data are unreliable.]


Wind power is a threat to particular types of birds, particularly birds of prey


It’s not just the total amount of birds that are killed that matters, but what types. If a particular species of bird is disproportionately affected it could have real impacts on population dynamics and risk of extinction.

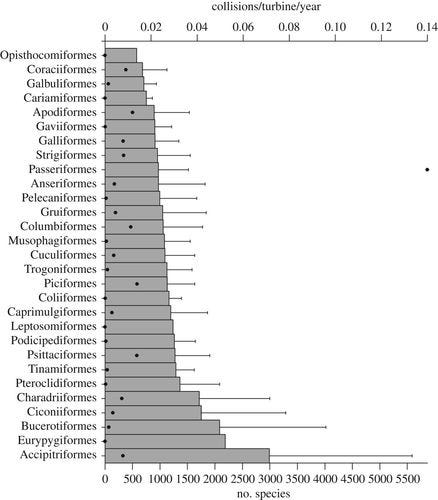
A study by Chris Thaxter and colleagues (2017) looked at the collision rates of different bird species from a large literature review. [See chart in original text]

In short, birds of prey such as eagles, raptors, and hawks; shorebirds; and storklike orders are at much higher risk of collisions than other families, such as songbirds. This disproportionate risk has been found across many other studies.

These species can be at a higher risk for several reasons. First, they will often use ridgetops to get lift from the wind. Incidentally, this is also a good spot for wind turbines. Second, they are often migratory birds; if wind farms are in their migratory route this puts them at higher risk. More indirect impacts of wind farms – which might not be reflected in death statistics – is their effect on the disruption of migratory patterns.

While the total number of birds killed by turbines is low compared to other hazards, the threat to particular species is more concerning. We need better mapping of key hotspots for these species so that wind farms can be deployed in suitable locations. More on how we can reduce these deaths later.


Wind power is probably a bigger threat to bats


I’ve mostly focused on bird fatalities, but wind power also kills bats. I found it harder to get good numbers here, but estimates suggest it’s in the range of 6 to 20 bats per turbine per year. Some estimates are even higher.

The Thaxter et al. (2017) paper that we just looked at also measured collision rates among bats. If you look at the scale of the ‘collisions/turbines/year’ you’ll see that it’s an order of magnitude higher.

Again, this tallies with other research that suggests that bats have higher mortality rates than birds for wind farm collisions.

We can reduce bird and bat deaths from wind power


We’re not completely helpless in this dilemma. There’s a lot that we can do to limit the biodiversity impact of wind farms, even if fatality rates are not reduced to zero.4

Here’s what we can do:

1. Turn off wind turbines at very low speeds when bats are around


Bats tend to get hit by wind turbines when wind speeds are very low. They struggle to fly in windier conditions. That means we can prevent a lot of bat deaths by curtailing – switching off – our turbines when there isn’t much wind.

You might think that this would hinder energy supply and eat into owner profits. But studies suggest it doesn’t make much difference.

A study from Pennsylvania reduced bat deaths by 44% when wind turbines were turned on at 5, rather than 3.5 metres per second.5 And they fell by 93% when this was increased to 6.5 metres per second.

A study in Australia found that raising the wind speed threshold from 3 to 4.5 metres per second reduced deaths by 54%, and the wind farm only lost 0.1% of revenue.6

Another study in Cadiz, in Spain, found that bird deaths were halved with only a 0.07% loss in energy production. That’s because the biggest risk was migratory birds – which pass through very occasionally. Shutting down production during this time was quick and saved many lives.

2. Don’t put wind farms in high-risk areas for birds and bats


Areas like ridgetops are prime spots for migratory birds and raptors that use the winds for uplift.

As we saw earlier, these species tend to be disproportionately affected by wind farms, so we should strive to avoid these areas.


3. Fewer larger turbines are better than many small ones


Birds and bats might be more likely to collide with a large turbine than a small one. But the question is whether a wind farm should have a few large turbines or lots of small ones.

The study by Thaxter et al. (2017) suggests the former. Fatality rates for both birds and bats tend to be higher in wind farms with turbines of very low capacity.

Having a small number of large turbines would therefore reduce fatality rates.


4. Paint the turbines black


When birds get close to turbines, the blades spin so quickly that it blurs their vision. But, if you paint the turbines black, it makes them much more visible.

Some tests of this approach in Norway reduced bird deaths by more than 70%.7

It might not be as effective for offshore farms, so that still needs to be tested.

5. Play alert noises to bats and birds to deter them


For some bat species, playing high-pitch sounds (which humans can’t hear) can deter them from the area. A study in Texas reduced the deaths of the deaths of two species of bats by 54% and 78%.8 It was then rolled out to many wind farms in the area.

Other systems can be used to identify eagles in the nearby area, and either emit distracting noises or switch the turbines off automatically.

6. Use GPS to track and find the optimal height for turbines


Surveillance technologies, such as GPS, can help scientists understand the flying patterns of migratory species. That means we can pick more optimal heights for turbines when they’re being constructed.

It can also alert wind farm generators that migratory flocks are in the area, so they can switch turbines off during high-risk times.


While some wildlife deaths from wind power might be unavoidable, there’s a lot that we can do to reduce them. It might come at very little cost to energy output and profit, so at a time when the world’s birds are under threat, it’s worth doing.

[Read more here]

Tuesday, February 13, 2024

Wind power exceeds gas in Europe in 2023


From Reuters


Wind power production outpaced gas plants in Europe for the first time last year as fossil fuel electricity generation plummeted, cutting the region's carbon emissions, data from think-tank Ember showed.

Europe is ramping up its renewable electricity generation as part of efforts to wean the bloc off Russian fuels and to help meet its climate goal of net zero emissions by 2050.

Europe's fossil fuel power generation fell by a record 19% year-on-year in 2023, with gas-fired electricity production down 15% and coal electricity production down 26% the report by Ember showed.

At the same time wind power grew by 13% to account for 18% of Europe's overall electricity mix, the data showed.

"Europe is on a path to phasing out coal and we've now had four years in a row of falling gas generation which we believe will continue," Dave Jones, the global insights lead for climate think-tank Ember, said in an interview.

The drop in fossil fuel power and increase in renewables and nuclear generation led to a 19% drop in carbon emissions from the power sector, the report showed.

Gas plants provided almost 17% of Europe's electricity in 2023 while coal provided just over 12%, the data showed.

Nuclear was the largest single source of electricity last year, accounting for almost 23% the data showed while solar power provided 9%.

Overall renewables combined rose to a record 44% share of power in 2023.

The data showed electricity demand fell 3.4% in 2023 due to a drop in industrial consumption and amid mild weather but Jones said this is expected to rise this year as more products, such as heating and vehicles are powered by electricity.

"Renewables will need to keep pace with that demand increase in order to deliver the emissions cuts needed," Jones said.


Wednesday, January 31, 2024

Wind turbines are friendlier to birds than oil and gas


From The Economist


Birders get nervous when they see landscapes covered in wind turbines. When the wind gets going, their blades can spin at well over 200km per hour. It is easy to imagine careless birds getting chopped to bits. Campaigners often point to the possibility when opposing the building of new wind farms.

No one doubts that wind turbines do indeed kill at least some birds. But a new analysis of American data, published in Environmental Science & Technology, suggests the numbers are negligible, and have little impact on bird populations.

Wind power has expanded dramatically in America over the past 20 years, from 2.6 gigawatts of installed capacity on land in 2000 to 122 gigawatts in 2020. Many studies have analysed the effects in specific locations or on specific bird species. But few have looked at the effects on wildlife at the population level. Enter Erik Katovich, an economist at the University of Geneva. Dr Katovich made use of the Christmas Bird Count, a citizen-science project run by the National Audubon Society, an American non-profit outfit. Volunteers count birds they spot over Christmas, and the society compiles the numbers. Its records stretch back over a century.

Dr Katovich assumed, reasonably, that if wind turbines harmed bird populations, then the numbers seen in the Christmas Bird Count would drop in places where new turbines had been built. He combined bird population and species maps with the locations and construction dates of all wind turbines in the United States, with the exceptions of Alaska and Hawaii, between 2000 and 2020. He found that building turbines had no discernible effect on bird populations. That reassuring finding held even when he looked specifically at large birds like hawks, vultures and eagles that many people believe are particularly vulnerable to being struck.

But Dr Katovich did not confine his analysis to wind power alone. He also examined oil-and-gas extraction. Like wind power, this has boomed in America over the past couple of decades, with the rise of shale gas produced by hydraulic fracturing, or fracking, of rocks. Production rose from 37m cubic metres in 2007 to 740m cubic metres in 2020.

Comparing bird populations to the locations of new gas wells revealed an average 15% drop in bird numbers when new wells were drilled, probably due to a combination of noise, air pollution and the disturbance of rivers and ponds that many birds rely upon. When drilling happened in places designated by the National Audubon Society as “important bird areas”, bird numbers instead dropped by 25%. Such places are typically migration hubs, feeding grounds or breeding locations.

Wind power, in other words, not only produces far less planet-heating carbon dioxide and methane than do fossil fuels. It appears to be significantly less damaging to wildlife, too. Yet that is not the impression you would get from reading the news. Dr Katovich found 173 stories in major American news outlets reporting the supposed negative effects that wind turbines had on birds in 2020, compared with only 46 stories discussing the effects of oil-and-gas wells. Wind turbines might look dramatic. But their effect on birds is not.


Sunday, November 26, 2023

Cutting wind costs by another 75%

The LCOE (=cost per MW of output) for wind has fallen from $135/MWh to $50/MWh (~65%) since 2009.  It rose last year and the year before because of supply chain issues, but seems to have fallen again, though I won't have definitive data until Lazard re-does their estimates next year.

But what if we could cut costs again, by another 65%?

Conventional wind turbines are of two kinds:  those with vertical axes (Vertical Axis Wind Turbines, or VAWT) and horizontal axis wind turbines (obviously, HAWT)  The giant turbines of wind farms are HAWT, lots of small wind turbines are VAWT.  

The biggest reason for the steady fall in the LCOE of wind has been because turbines have got steadily bigger and bigger.  But we are surely approaching the size limits of HAWTs.

Windloom, a US wind energy start-up, has found a completely new way to create electricity from the wind.  And it claims that far from costing $50/MWh, its wind "turbines" (only they're not actually turbines) produce electricity at an LCOE of just $13/MWh, or 1.3 cents per kWh.   Compare this with the average US residential tariff of 23 cents/kWh.

How does their system work?   

There is an oval "track", supported by poles about 30 metres high, from which vanes (which they call "wings") are suspended, and as they move around this track, electricity is generated.  The entire device can fit on the back of a trailer.


Remember that this is a new technology, and there will be many wrinkles to iron out.   For example, will it only work in one wind direction?  At how low and how high a wind speed can it continue to operate?  What is the wear and tear on the elevated track and the "wings"?  Has maintenance been included in the estimated LCOE?

If it works, it will make wind once again (by far) the cheapest source of electricity.   What's more, this cheapness won't depend on size---even a quite small (2.5 MW) installation will be this cheap.  And because the Airlooms are small, they should be able to be distributed widely around the grid.  Each small town could have a few, allowing for microgrids, not just in developed countries but also in poor ones which don't have a national grid.   The size demonstrated is too large for a single house, but could work for factories, schools, hospitals, etc.   My town (population 27,000) would require 10 of these, ignoring existing roof-top solar, with a capital cost of under $10 million, or just $370 per inhabitant.   That is my electricity bill for one quarter! And unlike giant wind turbines, the Airlooms will be much less visible.

Renewables are already cheaper than fossil fuels in most places.   The Airloom wind "turbine" will make renewables irresistible, and will usher in an age of incredibly cheap energy.  Let's hope it's a goer!

Friday, January 20, 2023

Super climate action tipping points


When I saw the headline, I thought of climate tipping points. But these are tipping points in things which will reduce and reverse emissions.

With wind and solar and batteries and EVs, there were steep learning curves. Initially, the new technologies were very expensive, and volumes produced/sold were very low. In fact, they had to be subsidised at first, with wind and solar receiving high feed-in tariffs and EVs getting tax refunds or subsidies. But the learning curve processes worked. As production expanded, costs fell, which allowed sales to increase which led to further cost declines, and so it went. Today, wind and solar are the cheapest source of bulk energy. In Australia, early and vigorous support for rooftop solar led to precipitous declines costs as everybody in the system (electricians, local councils, the grid managers, panel/inverter importers) learnt how to install solar panels, connect them to the grid, etc. Today, rooftop solar is widespread and "normal" in Australia.

I have seen the argument that if we had started the subsidies for wind and solar and EVS earlier, we'd have started moving down the learning curve earlier, and we'd be closer to a zero-carbon grid. And I think that's true. What the Guardian's piece suggests is that we can repeat this process with other sources of emissions. Which makes a lot of sense (try telling that to the Right, though)


Three “super-tipping points” for climate action could trigger a cascade of decarbonisation across the global economy, according to a report.

Relatively small policy interventions on electric cars, plant-based alternatives to meat and green fertilisers would lead to unstoppable growth in those sectors, the experts said.

But the boost this would give to battery and hydrogen production would mean crucial knock-on benefits for other sectors including energy storage and aviation.

Urgent emissions cuts are needed to avoid irreversible climate breakdown and the experts say the super-tipping points are the fastest way to drive global action, offering “plausible hope” that a rapid transition to a green economy can happen in time.

The tipping points occur when a zero-carbon solution becomes more competitive than the existing high-carbon option. More sales lead to cheaper products, creating feedback loops that drive exponential growth and a rapid takeover. The report, launched at the World Economic Forum in Davos, Switzerland, said the three super-tipping points would cut emissions in sectors covering 70% of global greenhouse gas emissions.

Speedy action is vital to help avoid triggering disastrous tipping points in the climate system. Scientists said recently that global heating had driven the world to the brink of multiple tipping points with global impacts, including the collapse of Greenland’s ice cap and a key current in the north Atlantic.

“With time running out, there is a need for action to be targeted,” said Mark Meldrum, at the consultancy Systemiq, which produced the report with partners including the University of Exeter, UK. Each super-tipping point crossed raises the chance of crossing others, he said. “That could set off a cascade to steer us away from a climate catastrophe.”

The tipping point for electric vehicles is very close with sales soaring, the report says. Setting dates around the world for the end of sales of fossil-fuel powered vehicles, such as the 2030 date set for new vehicles by the UK and 2035 in China, drives further growth, the report adds.

This scale-up means the batteries used will become cheaper and these can be deployed as storage for wind and solar power, further accelerating the growth of renewables. More green energy means lower electricity bills, in turn making heat pumps even more cost-effective.

The second super-tipping point is setting mandates for green fertilisers, to replace current fertilisers, which are produced from fossil gas. Ammonia is a key ingredient and can be made from hydrogen produced by renewable energy, combined with nitrogen from the air.

Governments requiring a growing proportion of fertiliser to be green will drive a scale-up and cost reductions in the production of green hydrogen, the report says. That then supports long-distance aviation and shipping, and steel production, which will rely on hydrogen to end their carbon emissions. Mandates are being considered with India, for example, targeting 5% green fertiliser production by 2023–24 and 20% by 2027–28.

The third super-tipping point is helping alternative proteins to beat animal-based proteins on cost, while at least matching them on taste. Meat and dairy cause about 15% of global emissions. Public procurement of plant-based meat and dairy replacements by government departments, schools and hospitals could be a powerful lever, the report says.

Increasing uptake would cut the emissions from cattle and reduce the destruction of forests for pasture land. A 20% market share by 2035 would mean 400m-800m hectares of land would no longer be needed for livestock and their fodder, equivalent to 7-15% of the world’s farmland today, the report estimated. That land could then be used for the restoration of forests and wildlife, removing CO2 from the air.

Tipping points already passed within countries include electric car sales in Norway and the plunge in coal-powered electricity in the US in the past decade.

“We need to find and trigger positive socioeconomic tipping points if we are to limit the risk from damaging climate tipping points,” said Prof Tim Lenton at the University of Exeter. “This non-linear way of thinking about the climate problem gives plausible grounds for hope: the more that gets invested in socioeconomic transformation, the faster it will unfold – getting the world to net zero greenhouse gas emissions sooner.”


The same argument potentially applies to things like small modular reactors (SMRs), electric planes, green steel production, etc.  


Thursday, January 12, 2023

EU installed 15 GW of wind in 2022


From ReNEWS.biz

The EU installed 15GW of new wind farms in 2022, a third more than 2021, according to WindEurope.

This increase in new installations is an encouraging result given the overlapping challenges the industry faced in 2022, the representative body said.

In terms of new capacity installed Germany, Sweden and Finland are leading the way, followed by Spain and France.

WindEurope found that 90% of the new wind capacity was onshore wind, which were nearly all in new greenfield sites.

However, it said that 15GW still falls significantly short of what Europe needs to build to deliver on its climate and energy security targets.

The shortfall is largely due to permitting bottlenecks, with 80GW of wind energy projects are currently stuck in permitting procedures across Europe.
WindEurope chief executive Giles Dickson said: "15GW new wind in 2022 is not too bad given the challenges faced last year by Europe’s wind industry.

'It’s not enough for the EU’s energy targets, but Governments know the latter can only be achieved if they simplify the permitting rules and procedures – and there are now signs of progress on this.

"Less encouraging is the slowdown in investments in new wind farms. Confusion about electricity market rules is turning investors away.

"The EU must make Europe an attractive place for renewables investments again."


 [15 GW of wind power at 40% capacity factor would supply about 2% of Europe's electricity demand.]

Thursday, October 27, 2022

Ovine wisdom

 I often think of sheep in Australia's excessive summer heat, often kept in fields where there is no shade, no way to escape.  In a recent piece, I talked about how sheep like solar panels because of the shade and better feed underneath them.

In this image from Tom Osborne, you can see sheep sheltering from the sun in the shade cast by a wind turbine.

So much for wind turbines and solar panels using all the agricultural land.  

I wonder if these sheep get cancer, as the denialists assert wind turbines cause?


Sunday, July 10, 2022

UK wind cheapest ever

 From The Guardian


The price of offshore wind power in the UK has fallen to an all-time low, which could ease the pressure on future household energy bills.

Following the biggest ever UK renewables auction, the government said on Thursday the contract price for windfarms was nearly 6% lower than the previous auction, despite the rising cost of materials to build windfarms. [In just the last year, UK consumer prices have risen 7%, so this is a material decline in real prices]

A string of new contracts should add about 7 gigawatts of clean power capacity to Britain’s turbine fleet by 2026. The government hopes to have 50GW by 2030 and has embarked on a push to expand Britain’s renewables industry in the face of rocketing fossil fuel prices.

Russia’s invasion of Ukraine has exacerbated an already volatile oil and gas market and left countries scrambling to shore up their energy supplies.

UK ministers have been forced to ask coal-fired power plants to continue their operations through the winter for fear of blackouts caused by energy shortages.

However, renewable energy including wind power is seen as central to Britain’s goal of hitting net zero carbon by 2050.

Offshore windfarm operators will sell power for as little as £37.35 per megawatt hour [US$44.82, which is *very* cheap], 5.8% below the lowest bid in the most recent auction in 2019.

The “contracts for difference” guarantee wind-power companies fixed prices to sell electricity for the following 15 years. If the market price falls below the contract price, the government subsidises the difference. If the market is higher, the companies pay money back to the government.

Since wholesale energy prices began to rocket last year, windfarms have begun paying back money to the government.

The easing of an effective moratorium on new onshore windfarms – which was imposed in 2015 – meant onshore wind and solar energy were both included in an auction for the first time in seven years. Onshore wind is now about 45% of the price secured in the auction in 2015. [A real fall of 60% after allowinf for inflation]

Among the winners from the auction were the Danish power company Ørsted, Scottish Power and Sweden’s Vattenfall.

Ørsted landed the contract for the world’s biggest offshore wind project, at Hornsea Three, 100 miles (160km) off the east Yorkshire coast. It is hoped the project will produce enough renewable electricity to power 3.2m UK homes.

Scottish Power secured a contract for the East Anglia Three offshore wind project, five onshore wind projects and 10 solar sites. Vattenfall agreed terms for the Norfolk Boreas offshore windfarm, which it said would meet the needs of about 1.5m homes.

It is hoped the projects will help to eventually bring down bills for consumers, which are expected to top £2,800 from October.

The business secretary, Kwasi Kwarteng, said: “Eye-watering gas prices are hitting consumers across Europe. The more cheap, clean power we generate within our own borders, the better protected we will be from volatile gas prices that are pushing up bills.”

Ørsted turbines at the Hornsea One field. The Danish company has won the contract for the world’s biggest offshore wind project at Hornsea Three. Photograph: Ørsted/EPA


Offshore wind used to be much more expensive than onshore wind.  But we've moved fast down the learning curve.  Offshore wind is prized because they wind blows more and more often offshore than onshore, which brings wind power closer to baseload.

Friday, June 10, 2022

Costs of running an EV in the UK

 From a Twitter thread by Katy Duke

Fuel costs of running an ICE v BEV updated yesterday. There are 3 BEV consumptions + av. cost pa. Have been on night tarrif from @OctopusEnergy for just a week! ICE costs 21.98p per miles, BEV is 1.79p per mile on night charge.


This is the lowest priced dealer EV locally https://drive-green.co.uk/used_evs/2011-peugeot-ion-km11umc/… £5895. HP £6685 = £127 pm + £590 deposit = £1525 pa

2011 Peugeot iOn EV

Replies to her tweet pointed out that some shopping centres and supermarkets offered free charging, so the public charge costs could be lower. Note also, that maintenance costs for EVs are lower than for ICEVs, because they have ten times fewer moving parts.  In Australia, electricity is also cheap at mid-day as well as late at night, because we have more solar than the UK, which relies much more on wind.  Obviously, that means that when demand is low, late at night, but supply continues, because the wind blows at night, the wholesale price of electricity plunges.   A good time to charge your car and heat your house

And if you have your own solar panels, you can charge your car, effectively for whatever your feed-in tariff is (in Oz, feed-in tariffs are low)  Also, how good it is to be able to buy a second-hand EV, thanks to early subsidies which increased sales years ago.  Australia has hardly any second-hand EVs, so cheap up-front entry to the EV world isn't possible here.  For that, blame the right-wing LNP government, recently, thank goodness, comprehensively voted out of office.

Tuesday, April 19, 2022

De-carbonising electricity generation

  1. We'll need both wind and solar, plus hydro, tidal, small hydro, and wave power, and any legacy nuclear.   The reason we'll need both wind and solar is that the wind blows at night, when the sun isn't shining, and also that they are negatively correlated.  In summer in high latitudes, the wind drops off, but solar is surprisingly strong.  In winter, the sun in high latitudes is dim, but the winds tend to be strong.  Together, wind and solar can produce much less variable output than either on its own, except in the tropics.
  2. We'll need 4 hours of storage.  4 hours will be enough to handle the morning and evening peaks in demand, and to do some short-term smoothing of the random fluctuations in wind, though geographically diversified wind farms will help with this.  But 4 hours will not be enough to take wind and solar to more than 90% of total generation.  We'll need long-term storage for that.
  3. We'll have built-in generation overcapacity.  Remember, that wind and solar variability can mean not just too little generation but also too much.  Up to now, when it's potentially too much, the grid operators curtail output of wind and commercial solar farms.  They're also getting the ability to curtail output of rooftop solar too, in many locations.  In future, this output will not be lost but used to generate green hydrogen.
  4.  Storing hydrogen is hard.  Its atoms are very small and easily escape through the interstices between larger atoms, meaning the using hydrogen for seasonal storage will be much less effective than using methane.  It also makes pipelines brittle.  Green methane can be made from hydrogen using the Sabatier method, with a small additional loss of energy.  Methane is already routinely stored for months with minimal losses; there are already methane (natural gas) grids in most mid- to high-latitude developed countries, where seasonal storage will be needed; gas peaking plants will not need to be retro-fitted to handle hydrogen; methane is much easier to store and transport than hydrogen; and it can be used for heating, though electric heat pumps may be cheaper and more efficient.
  5. It's possible, though I am not convinced, that we will need some small percentage (10- 20%) of nuclear in the grid.  But we are a long way from 80% wind and solar penetration in most global grids--the most recent data have the global average at 10%.  Setting aside legacy nuclear, new nuclear, if it happens, will tend to be smaller plants, because the giants are just so expensive.  I've talked about SMRs, micro nuclear and the great potential for hydrogen-boron fusion reactors, but these are all at least 5 to 10 years away from them being successfully deployed.
  6. Micro-hydro, tidal power, wave power and electricity generated from incinerating/gasifying rubbish will all be handy additions to the grid, because they  are uncorrelated with wind and solar.  Even waves, which are driven by wind, can be created by winds hundreds of kilometres away.


OK, how does the actual transition happen?

  1. We could leave it to the market.  Wind and solar are much cheaper than new coal and gas, and comparable to existing coal and gas in most places on the globe.  As existing fossil fuel power stations age, they will be replaced by renewables plus storage.  This will take decades, however, so, since we want to substantially reduce emissions from power generations as quickly as possible, we'll need to give this process a nudge.
  2. We could set targets for renewables.  Each utility/electricity producer will be required to achieve an annual/quarterly percentage from renewables, rising steadily over time, aiming for 100% within a decade.   Those utilities which exceed this target will earn carbon credits, those utilities which don't reach this target will have to buy credits.  This carbon penalty will encourage utilities to build out more wind and solar farms, as well as other renewable supply, including nuclear.
  3. We could run a reverse auction where individual power stations would offer to close down for a fee.  Let's say a decline of 10% a year in emissions from electricity generation is required.  Each year, the government would offer a lump sum payment to the power stations which would close down, choosing those with the lowest offers until the total reaches 10% for that year.  Conditions could be applied to any deals: redundancy payments to workers; requiring the output of the power station to be replaced with new "firmed" output from renewables; making sure the new wind and solar farms are located close to the communities where coal power stations are ceasing to operate.

Source: Our World in Data


Sunday, January 23, 2022

Wind and solar costs have risen recently

 From Inside Clean Energy


For more than a decade, companies that wanted to buy wind and solar power got to enjoy the fact that the prices for renewable energy got cheaper almost every year.

Then, prices began to rise in some places, with the trend becoming clear by the end of 2020. It was easy to dismiss this as a mere blip due to economic disruption caused by the pandemic.

But prices continued to increase in 2021, and I’m wondering how long this is going to last.

“We’re in particularly weird times,” said Ben Serrurier, a manager in the carbon-free electricity practice at RMI, the research and advocacy group.

He said price increases aren’t surprising, considering the high demand for renewable energy and the many challenges that developers are facing in trying to build projects to generate it.

The prices reflect rising costs and high levels of uncertainty for the wind and solar developers offering the contracts, said Rob Collier, vice president of developer solutions for LevelTen Energy, a Seattle company that runs an online marketplace for buyers and sellers of renewable energy.

“What we’re seeing in the market is a huge surge in demand” for wind and solar from buyers, he said. “At the same time we’re seeing a shortfall of viable projects to meet that demand.”

Prices being offered by developers selling U.S. wind and solar contracts rose 15.7 percent in 2021 compared to the prior year, reaching $36.30 per megawatt-hour, according to the P25 index produced by LevelTen, released this month as part of the company’s quarterly report on national and regional price trends.

Wind and solar projects are facing delays because of shortages of raw materials, bottlenecks in international shipping and a backlog of applications for grid connections with regional grid operators, the report said.

Developers also are having to deal with more challenges to their obtaining state and local building permits, sometimes in the form of counties passing ordinances restricting new projects. Indiana is one of the places this is happening, with county ordinances that restrict projects being adopted in large swaths of the state, as I reported last year.

Federal policy is another factor. In 2018, the Trump administration imposed tariffs on imported solar cells and panels, and the U.S. International Trade Commission is recommending that the Biden administration extend the tariffs for an additional four years.

Some of the causes of the price increases could go on for a while. A good example is the grid operators’ backlog, which could take years to resolve in some parts of the country.

But Collier sees a hopeful story as well, which is that demand for wind and solar remains strong, even with higher prices. For example, the Clean Energy Buyers Association, a group of corporate giants like Amazon and Google, made agreements to buy 7.88 gigawatts of renewable energy capacity in the first three quarters of 2021, which was on pace to match the record of 10.63 gigawatts from 2020.

The buyers of wind and solar contracts include corporations, governments or any other entities that want the reputational and financial benefits of renewable energy. The financial benefits come from the way long-term contracts for renewable energy can serve as a financial hedge against volatile electricity market prices.

Another leading source of price data for wind and solar is the Lawrence Berkeley National Laboratory, which showed in its most recent reports that wind and solar contract prices had leveled off after years of declines and were rising in some places.

Recent price increases are jarring considering that, from 2009 to 2021, the average price of U.S. solar power contracts fell by about 15 percent per year, according to the lab’s data. Wind power contract prices also had steadily fallen between 2009 and 2018, with the exception of an increase in 2015.


Saturday, January 22, 2022

Germany installs 2 GW of onshore wind

 From ReNEWS


Germany installed just shy of 2GW of new onshore wind capacity in 2021, according to figures published by Deutsche WindGuard and VDMA Power Systems.

The 1925MW of capacity built in 2021 comprised 484 turbines, resulting in 35% growth compared with 2020’s installation figure of 1431MW.

VDMA Power Systems managing director Dennis Rendeschmidt said: “The expansion is increasing, but only regionally and overall at too low a pace.

“That is why the concrete measures for accelerated expansion mentioned in the immediate programme by Federal Minister of Economics Robert Habeck are absolutely necessary.

“Two percent of the land area is required in each federal state as a minimum basis for the expansion of wind energy in Germany.”

For 2022 the associations expect an expansion of 2.3GW to 2.7GW on the basis of an evaluation of projects that have already been awarded and the speed of implementation of tendering systems to date.

They stated: “Regulated processes in the supply chains, simplified and plannable transport permits, the upgrading of the transport infrastructure and the flexible availability of labour are of high relevance in order to achieve higher expansion targets.”


In 2021, Germany installed 5.3 GW of solar.  Its total installed electricity capacity in 2020 was 218 GW, and 50.5% of production was from renewable sources


Source: Wikipedia


Thursday, January 13, 2022

US renewables adding 2,250 GW of capacity every month

 From Renewables Now


According to a review by the SUN DAY Campaign of data recently released by the Federal Energy Regulatory Commission (FERC) and the US Energy Information Administration (EIA), solar, wind and other renewable energy sources (i.e., biomass, geothermal, hydropower) are now adding more than 2,250 MW of new generating capacity each month. For perspective, that is more than the planned generating capacity (2,200-MW) of the two reactors at the Vogtle nuclear plant in Georgia that have been under construction since 2013 and for which there is still no certain completion date.

According to the latest issue of FERC's "Energy Infrastructure Update" (with data through October 31, 2021), utility-scale (i.e., >1-MW) renewable facilities added 18,255-MW of new generating capacity during the first 10 months of 2021 or an average of 1,826-MW per month. Separately, in its latest "Short-Term Energy Outlook," EIA forecasts that small-scale (i.e., <1-MW), distributed (e.g., rooftop) solar will grow by about 5,100-MW in 2021 - or about 425-MW per month. Thus, utility-scale renewables plus distributed solar are now providing - on average - over 2,250-MW of new capacity each month.

Solar and wind dominated new US electrical generating capacity additions during the first 10 months of 2021 adding 9,604-MW and 8,580-MW respectively. Including new hydropower (28-MW), geothermal (25-MW) and biomass (18-MW), renewables provided 83.6% of all new generating capacity through the end of October. New renewable capacity was more than five times greater than that of natural gas (3,549-MW). There was no new nuclear capacity added in 2021 while new oil and coal capacity increased by just 19-MW and 11-MW respectively.

Renewables now provide more than a quarter (25.47%) of total US available installed generating capacity - a share significantly greater than that of coal (18.77%) and more than three times that of nuclear power (8.32%). By comparison, a year ago, renewables' share was only 23.31%. Five years ago, it was 18.58% and a decade earlier it was 14.12%.

That growth is almost entirely attributable to a nearly three-fold increase in wind's share of installed generating capacity and a 35-fold increase in solar's share. Wind is now more than a tenth (10.54%) of the nation's generating capacity (up from 3.80% in October 2011) while utility-scale solar has surpassed five percent (5.21%) - up from 0.15% in October 2011 ... and that does not include small-scale distributed solar.

Moreover, during the first 10 months of 2021, solar and wind have each set new records for capacity additions. The 9,604-MW of new solar thus far reported by FERC for the first 10 months of 2021 dwarfs the 6,516-MW added during the same time period in 2020 or the 3,758-MW added in 2019. Likewise, the 8,580-MW of new wind capacity significantly exceeds the 7,161-MW reported for 2020 or the 4,721-MW added in 2019.

The increase in solar and wind capacity is manifesting itself in ever-higher levels of electrical generation by those sources. According to the latest issue of EIA's "Electric Power Monthly" report (with data through October 31, 2021), utility-scale solar and wind generation during the first 10 months of 2021 increased by 27.9% and 11.1% respectively compared to the same period in 2020. Wind now accounts for 8.64% of US electrical production while solar - including small-scale - is providing 4.08%.

In addition, FERC data suggest that the share of generating capacity from solar and wind is on track to increase significantly over the next three years (i.e., by October 2024). FERC notes that there may be as much as 170,941-MW of new solar capacity in the pipeline with 52,692-MW classified as "high probability additions" offset by only 92-MW of projected "retirements." Just a year ago, FERC reported 128,001-MW of solar in the three-year pipeline with 32,784-MW classified as "high probability." In addition, new wind capacity by October 2024 could total 71,929-MW with 23,180-MW being "high probability" and only 150-MW of retirements expected. [This total new capacity planned monthly is 3 times as high as it's been over the last year.]


Source: EIA