Showing posts with label La Niña. Show all posts

Tuesday, November 11, 2025

Third hottest September ever

From Berkeley Earth.

This chart shows the temperature anomaly relative to the 1850 -1900 September average temperature, for each September since 1850.  You can see how temperatures spiked during El Niño, and have since been falling as El Niño was replaced by La Niña.  The red line shows the trend, which you can see is accelerating.  This is the third-warmest September on record.

September 2025 was the third warmest September on record behind 2023 and 2024, with a global average of 1.48 ± 0.15 °C (2.67 ± 0.26 °F) above the 1850-1900 average.


This chart shows the 12-month moving average of the temperature anomalies up to September 2025.  The 12-month moving average has rolled over after the end of El Niño, but don't mistake this for a change in the longer-term trend, shown by the red LOESS smoothed line.


With the Paris Climate Agreement (COP21), 10 years ago, the world agreed to aim for a maximum increase in temperatures over the 1850-1900 average of 1.5 degrees C.  We're there already, and even though temperatures have fallen marginally from the El Niño high 3 years ago, the trend is inexorably upwards.  We have failed.  COP conferences have turned into pointless gabfests, where lobbyists from fossil fuel industries outnumber government delegates.

Only the continued decline in solar panel, battery and EV costs gives me any hope that mankind will act quickly enough to cut emissions and prevent a climate catastrophe.


Wednesday, February 5, 2025

The January global temperature is really, really bad

 From Brian Bretschneider


Global average January temperature - color coded by ENSO status. One of these years is not like the others.

The chart shows the average January temperature for the world. Red dots show El Niño years, blue dots La Niña. During El Niño, air temperatures are higher, as heat is released from the sea. During La Niña, the reverse is true: air temperatures are cooler as more heat is absorbed by the oceans. Notice how temperatures above the trend line are mostly red dots (El Niño), while temperatures below the trend line are mostly blue dots. January 2025 is the glaring exception. It is now a La Niña phase, yet global temperatures moved to a new maximum.

click on chart to enlarge


Tuesday, January 21, 2025

World temperatures still rising.

From Prof Eliot Jacobson

Daily global surface temperature updates were delayed a few days. They were finally posted this morning. And the records keep on falling. [The *temperatures* keep on rising] 
So glad El Niño is over and La Niña is helping cool things down ...


1.8 degrees above pre-industrial levels.  Yet still we do nothing.

Friday, November 22, 2024

Rise in world's temperatures accelerates

 Open Mind (Tamino) produced a previous piece about the acceleration in the rise in global temperatures, which I reported on here.  He has returned to the analysis, and confirms his position in his latest post


I now have global temperature data through October of this year from NASA, NOAA, and ERA5, as well as data through September from HadCRU and Berkeley. I’ve translated them to “since pre-industrial” values using one of the methods in the IPCC special report on 1.5°C. Then I computed yearly averages (this year is incomplete so values for 2024 are year-so-far averages)


There are two clear episodes in this plot: before and after 1975. Before, GMST was fluctuating but not trending either way; since, it has been trending consistenly up and fluctuating. As for its rate of increase, for four and a half decades (from 1975 until 2020) temperature seemed to rise at a pace (about 0.02°C per year) that was unchanging, and statistics couldn’t deny it.

But the last two years (2023 and 2024) have been “off the charts,” so to speak. For the data from ERA5, the value for 2024 year-so-far is already above 1.5°C, which is exactly what the Paris agreement seeks to avoid.
I investigated the rate of warming, and how it may have changed over time, in two ways. First, I fit a modified lowess smooth which I’ve programmed to estimate the rate as well as the value. Second, I computed a piecewise linear fit (PLF) with knots at 1975 and 2010. Both models (lowess and PLF) were fit to the monthly-average data, but in the graphs that follow I’ll plot yearly averages so the graphs will be less cluttered. Here’s how the PLF model fits the data from NASA:


PLF = piecewise linear fit 


[....]

For the 45-year period from 1975 through 2009, the average warming rate according to NASA data is just about 0.018°C/yr. For the 15-year period since 2010, it has been a lot faster at 0.031°C/yr. Statistically, the difference is significant at over 99% confidence.

I have also adjusted all the data sets, to compensate for the influence of el Niño, volcanic eruptions, and solar variations, with a method not unlike that of Foster & Rahmstorf (2011). Here are the adjusted temperatures, together with their PLF fit, for the data from NASA:
This chart shows the temperature anomaly adjusted for El Niño/La Niña and for vulcanism. 
PLF = piecewise least fit.


The rate from 1975 to 2010 now seems to be only 0.017°C/yr, and after 2010, the best estimate is 0.033°C/yr. These aren’t much different from the estimates using the raw data, although the uncertainties are now smaller so the confidence intervals are narrower.

Falling emissions (which of course we don't have--emissions continue to rise) do NOT mean that temperatures will start falling.  The RISE in the temperature anomaly is proportional to the LEVEL of emissions.  In other words, for temperatures to stop rising, we need to reduce emissions to zero.  If we halve emissions, the increase in temperature anomaly will halve, but that only reduces it to what it was before this recent acceleration, 0.17 degrees per decade.  

There are positive signs that emissions will peak soon.  Wind and solar continue to expand exponentially.  The costs of battery storage are plunging, and the recent first commercial solid-state battery points to continued and sustained cost declines and efficiency improvements.  Yet, even if we completely switch ALL electricity generation and ALL land transport to carbon-free methods, that will still only halve emissions.  If we were to start cutting emissions by 5% a year, compound, it would take us 40 years to reduce emissions to 10% of current levels.  Assuming we did this (but we are not) temperatures would rise for the next decade by 0.33 degrees, for the decade after by 0.17, by the decade after that by 0.l2 degrees and for the final decade by 0.06.  Roughly.  In other words, temperatures would rise by another 0.33+0.17+0.12+0.06, or ~0.7 degrees, making the rise since 1850-1900, the traditional "pre-industrial" starting point 2.2 degrees.

We face catastrophe, and still we dither and phaff.  The Right is dead against doing anything at all to slash emissions, and the Left argues with itself about what to do.  Meanwhile, we are lied to by corporations and governments, and protesters go to jail while oil execs are fêted.


Monday, August 19, 2024

Climate models can't explain 2023's huge heat anomaly

Source: NOAA
Note: this is relative to 1901-2000 average
Relative to the 1850-1900 average, the anomaly is already over 1.5 degrees C


From Nature, by Gavin Schmidt

When I took over as the director of NASA’s Goddard Institute for Space Studies, I inherited a project that tracks temperature changes since 1880. Using this trove of data, I’ve made climate predictions at the start of every year since 2016. It’s humbling, and a bit worrying, to admit that no year has confounded climate scientists’ predictive capabilities more than 2023 has.

For the past nine months, mean land and sea surface temperatures have overshot previous records each month by up to 0.2 °C — a huge margin at the planetary scale. A general warming trend is expected because of rising greenhouse-gas emissions, but this sudden heat spike greatly exceeds predictions made by statistical climate models that rely on past observations. Many reasons for this discrepancy have been proposed but, as yet, no combination of them has been able to reconcile our theories with what has happened.

For a start, prevalent global climate conditions one year ago would have suggested that a spell of record-setting warmth was unlikely. Early last year, the tropical Pacific Ocean was coming out of a three-year period of La Niña, a climate phenomenon associated with the relative cooling of the central and eastern Pacific Ocean. Drawing on precedents when similar conditions prevailed at the beginning of a year, several climate scientists, including me, put the odds of 2023 turning out to be a record warm year at just one in five.

El Niño — the inverse of La Niña — causes the eastern tropical Pacific Ocean to warm up. This weather pattern set in only in the second half of the year, and the current spell is milder than similar events in 1997–98 and 2015–16.

However, starting last March, sea surface temperatures in the North Atlantic Ocean began to shoot up. By June, the extent of sea ice around Antarctica was by far the lowest on record. Compared with the average ice cover between 1981 and 2010, a patch of sea ice roughly the size of Alaska was missing. The observed temperature anomaly has not only been much larger than expected, but also started showing up several months before the onset of El Niño.

So, what might have caused this heat spike? Atmospheric greenhouse-gas levels have continued to rise, but the extra load since 2022 can account for further warming of only about 0.02 °C. Other theories put forward by climate scientists include fallout from the January 2022 Hunga Tonga–Hunga Ha‘apai volcanic eruption in Tonga, which had both cooling effects from aerosols and warming ones from stratospheric water vapour, and the ramping up of solar activity in the run-up to a predicted solar maximum. But these factors explain, at most, a few hundredths of a degree in warming (Schoeberl, M. R. et al. Geophys. Res. Lett. 50, e2023GL104634; 2023). Even after taking all plausible explanations into account, the divergence between expected and observed annual mean temperatures in 2023 remains about 0.2 °C — roughly the gap between the previous and current annual record.

There is one more factor that could be playing a part. In 2020, new regulations required the shipping industry to use cleaner fuels that reduce sulfur emissions. Sulfur compounds in the atmosphere are reflective and influence several properties of clouds, thereby having an overall cooling effect. Preliminary estimates of the impact of these rules show a negligible effect on global mean temperatures — a change of only a few hundredths of a degree. But reliable assessments of aerosol emissions rely on networks of mostly volunteer-driven efforts, and it could be a year or more before the full data from 2023 are available.

This is too long a wait. Better, more nimble data-collection systems are clearly needed. NASA’s PACE mission, which launched in February, is a step in the right direction. In a few months, the satellite should start providing a global assessment of the composition of various aerosol particles in the atmosphere. The data will be invaluable for reducing the substantial aerosol-related uncertainty in climate models. Hindcasts, informed by new data, could also provide insights into last year’s climate events.

But it seems unlikely that aerosol effects provide anything close to a full answer. In general, the 2023 temperature anomaly has come out of the blue, revealing an unprecedented knowledge gap perhaps for the first time since about 40 years ago, when satellite data began offering modellers an unparalleled, real-time view of Earth’s climate system. If the anomaly does not stabilize by August — a reasonable expectation based on previous El Niño events — then the world will be in uncharted territory. It could imply that a warming planet is already fundamentally altering how the climate system operates, much sooner than scientists had anticipated. It could also mean that statistical inferences based on past events are less reliable than we thought, adding more uncertainty to seasonal predictions of droughts and rainfall patterns.

Much of the world’s climate is driven by intricate, long-distance links — known as teleconnections — fuelled by sea and atmospheric currents. If their behaviour is in flux or markedly diverging from previous observations, we need to know about such changes in real time. We need answers for why 2023 turned out to be the warmest year in possibly the past 100,000 years. And we need them quickly.

Nature 627, 467 (2024)

doi: https://doi.org/10.1038/d41586-024-00816-z

We face a climate catastrophe.  And we are still doing too little to stop it.

Sunday, July 14, 2024

2024 likely to be another record year, despite La Niña


From Discover Magazine


As La Niña continues to stir in the tropical Pacific Ocean, the latest analysis shows there’s a 70 percent chance it will develop between August­ and October.

The climate phenomenon shifts the world's atmospheric circulation, changing weather patterns around the globe. Characterized by cooler-than-average sea surface waters in large swaths of the tropical Pacific, it also usually takes the edge off human-caused heating of the planet, albeit temporarily.

But even taking that likely cooling effect into account, a new annual global heating record is very likely in 2024, according Gavin Schmidt, director of NASA's Goddard Institute for Space Studies.


Schmidt made the prediction on the Bluesky social media platform after his institute's analysis showed last month to be the warmest June on record. It was also the 13th straight month with record-breaking global temperatures. (Other analyses have shown the same, including one released by NOAA today.)

Last year shattered the record for the hottest year globally since record-keeping began in the 1800s. With an El Niño adding to the global heating caused by our continuing emissions of greenhouse gases, a new record in 2023 should not have come as a surprise. But the heat over land and in the seas was so extreme that scientists were nonetheless shocked — and they're still working hard to understand the details of what happened.


Thursday, July 11, 2024

Warming rate probably accelerating

 Another in depth statistical analysis from Open Mind (Tamino).  I won't repeat the whole article (best to read it for yourself).   In essence, what he does is look at the change in the temperature anomaly over 30 years, the conventional measure of climate change (because shorter periods are too susceptible to fluctuations from natural climate cycles such as, for example, El Niño/La Niña).    This chart shows what that looks like:


Note that the change over the 30-year span has been centred at 15 years,
which is why it apparently ends at 2009.


He then adjusts the data for volcanic eruptions, El Niño, and the sunspot cycle to test whether the change in trend since 2000 is statistically significant, and concludes that it is.


But wait, there’s more. We know the cause of some of the fluctuation, and we can adjust the data by removing our best estimate of those known factors. In particular, we can remove an estimate of the influence of volanic eruptions, solar variations, and the el Niño southern oscillation, and I’ve done so by a modified version of the method of Foster & Rahmstorf.

Comparing this graph of adjusted data since 1946, to the graph of raw data over the same time (the third graph in this post), two things are obvious. First, the level of scatter (of random fluctuation) is quite a bit less for the adjusted data than for the raw. Second, the “obvious” simple model for the raw data (a linear spline with two straight-line setments) isn’t so obvious for the adjusted data.

The same analysis used on the raw data, returns different results on the adjusted. This is mainly because the uncertainty levels are so much reduced. The warming rate for NASA data, for example, now looks like this:

Again, the change has been centred midway on the 30-year span

The final 30-year estimate suggests the rate was definitely bigger then 0.02°C/year, while the earlier rate is definitely less. Also, the statistical tests (fitting a parabola and a linear spline) now are definitely significant at 95% confidence.

Using adjusted rather than raw data, the same is true for all five data sources. While the significance is weakest for HadCRU and strongest for NOAA, it’s over 95% confidence for all of them. My conclusion is that recent acceleration of global warming isn’t just likely, it’s confirmed.

There is still room for doubt, if you doubt that the adjusted data represent things correctly then the recent apparent acceleration may be just random accident. All told, I find that too unlikely.


See also this piece I did, based on Open Mind's analysis: 

Terrifying acceleration in global heating

We are heading towards climate catastrophe, and still we do not act, stumbling blindly to the precipice.

Sunday, June 4, 2023

Global temperatures rising again

Despite three years of La Niña, global temperatures have started rising again.  This year, the world will experience an El Niño, and temperatures will rise as they always do during El Niños.  The chart shows the temperature anomaly relative to the 1901-2000 average.    The years from 1850 to 1900 were on average something like 0.2 degrees cooler, so a 1.5 degrees increase above pre-industrialisation temperatures would be reached when the red bars reach 1.3 degrees C on the chart.   Note the LOESS smoothing and its steady and inexorable rise.

The last El Niño peak was in 2016, with the anomaly reaching 1.14 degrees C.   Temperatures are rising by roughly 0.2 degrees C per decade, so a temporary El Niño peak of 1.3 degrees C above the 1901-2000 average in 2024 is plausible.   (The rise between the 1998 and 2016 El Niños was 0.44 degrees C).  And that would mean we would have (temporarily) breached the 1.5 degree guardrail for the first time in recorded history.

Temperatures won't stop rising until CO2 emissions fall to zero or close to that, though we might get a temporary respite if methane emissions are slashed.  However, both CO2 and CH4 emissions continue to rise.

Too little is being done to prevent catastrophe.


Source: NOAA


Monday, April 10, 2023

Ocean Temperatures off the charts

From The Guardian


The temperature of the world’s ocean surface has hit an all-time high since satellite records began, leading to marine heatwaves around the globe, according to US government data.

Climate scientists said preliminary data from the National Oceanic and Atmospheric Administration (NOAA) showed the average temperature at the ocean’s surface has been at 21.1C since the start of April – beating the previous high of 21C set in 2016.

“The current trajectory looks like it’s headed off the charts, smashing previous records,” said Prof Matthew England, a climate scientist at the University of New South Wales.

Three years of La Niña conditions across the vast tropical Pacific have helped suppress temperatures and dampened the effect of rising greenhouse gas emissions.

But scientists said heat was now rising to the ocean surface, pointing to a potential El Niño pattern in the tropical Pacific later this year that can increase the risk of extreme weather conditions and further challenge global heat records.

Dr Mike McPhaden, a senior research scientist at NOAA, said: “The recent ‘triple dip’ La Niña has come to an end. This prolonged period of cold was tamping down global mean surface temperatures despite the rise of greenhouse gases in the atmosphere.

“Now that it’s over, we are likely seeing the climate change signal coming through loud and clear.”

La Niña periods – characterised by cooling in the central and eastern tropical Pacific and stronger trade winds – have a cooling influence on global temperatures. During El Niño periods, the ocean temperatures in those regions are warmer than usual and global temperatures are pushed up.

According to the NOAA data, the second-hottest globally averaged ocean temperatures coincided with El Niño that ran from 2014 to 2016.

The data is driven mostly by satellite observations but also verified with measurements from ships and buoys. The data does not include the polar regions.

More than 90% of the extra heat caused by adding greenhouse gases to the atmosphere from burning fossil fuels and deforestation has been taken up by the ocean.

A study last year said the amount of heat accumulating in the ocean was accelerating and penetrating deeper, providing fuel for extreme weather.

England, a co-author of that study, said: “What we are seeing now [with the record sea surface temperatures] is the emergence of a warming signal that more clearly reveals the footprint of our increased interference with the climate system.”

Measurements from the top 2km of the ocean show the rapid accumulation of heat in the upper parts of the ocean, particularly since the 1980s.

Dr Kevin Trenberth, a climate scientist and distinguished scholar at the US National Center for Atmospheric Research, said observations showed the heat in the tropical Pacific was extending down to more than 100 metres.

He said that heat would have knock-on effects for the atmosphere above, creating more heat, adding energy to weather systems and causing marine heatwaves.

Dr Alex Sen Gupta, an associate professor at the UNSW Climate Change Research Centre, said satellites showed that on the ocean surface, temperature rises had been “almost linear” since the 1980s.

“What’s been surprising is that the last three years have also been really warm, despite the fact that we’ve had La Niña conditions,” he said. “But it is now warmer still and we are getting what looks like record temperatures.”


skip past newsletter promotio

Wednesday, January 18, 2023

Friday, January 13, 2023

2022 fifth or sixth warmest year on record

 From a tweet by John Kennedy


Six global surface temperature datasets. Three of them have 2022 as the 5th warmest year on record. The other three have it as 6th warmest. All of them agree that the past eight years 2015 to 2022 were the eight warmest years on record.

2022 was a La Niña year, so it was cooler than it would otherwise have been. If 2023 is an El Niño year, it is possible it will be the hottest ever recorded.


Temperatures have risen roughly 1.2 degrees C since pre-industrial times.

Friday, December 30, 2022

2023 likely to be hotter than 2022

2022 was a La Niña year, when global temperatures are temporarily reduced as part of the El Niño-Southern Oscillation (ENSO).  Most meteorologists are forecasting that 2023 will not be another La Niña year, but at this stage, it doesn't look like it will be an El Niño year, when temperatures reach new records.  (See the 1998 and 2016 El Niño years in NOAA's chart below)  So, prolly, higher temperatures on average, but not extreme.

The trend over the last 50 years is a rise of 0.18 degrees C per decade.  The rise in temperatures is proportional not to the rise in emissions, but to the level of emissions.  Emissions are levelling off (sort of), thanks to Covid, recessions, and the inexorable rollout of renewables. But to reduce the decadal increase in global temperatures to, say, 0.1 degrees, we will need to halve emissions.  And then, to get close to a zero decadal rise, we will need to halve them again.  It would be nice if we halved them over the next decade and halved them again in the 2040s.  But we prolly won't, despite some partial good news.

Source: NOAA


Saturday, August 6, 2022

July second hottest on record

 From a tweet by Zeke Hausfather


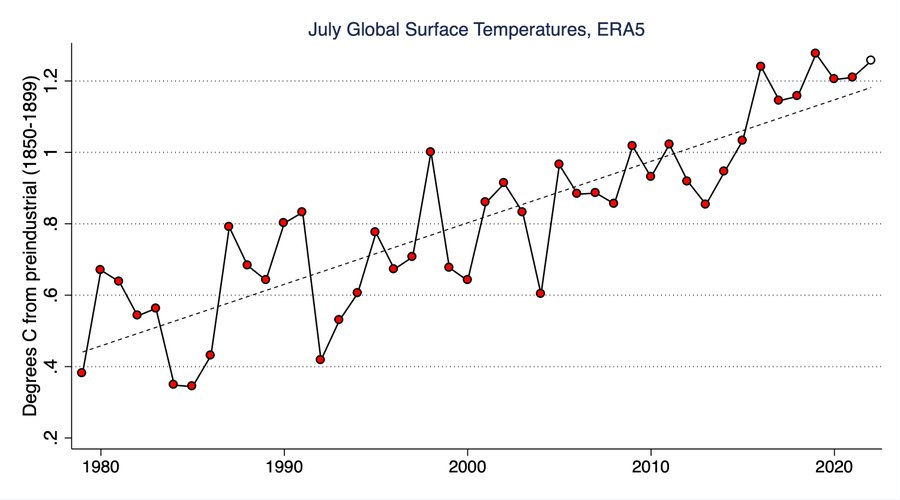
The first global temperature data for July is now in, and it was the 2nd warmest July on record in the
@CopernicusECMWF ERA5 dataset (only 2019 was warmer). July temperature have risen around 0.75C since 1979, and are current around 1.26 above preindustrial levels.


And this is a La Niña year, when temperatures are generally cooler.  What's more, with 'only' 1.26 degrees C increase since the second half of the 19th century, we are already getting record heatwaves, record floods, record bushfires and record droughts.  And emissions continue to rise.


Tuesday, June 7, 2022

Climate change: could La Niña become the norm?

 From The Conversation


Climate change is slowing down the conveyor belt of ocean currents that brings warm water from the tropics up to the North Atlantic. Our research, published today in Nature Climate Change, looks at the profound consequences to global climate if this Atlantic conveyor collapses entirely.

We found the collapse of this system – called the Atlantic meridional overturning circulation – would shift the Earth’s climate to a more La Niña-like state. This would mean more flooding rains over eastern Australia and worse droughts and bushfire seasons over southwest United States.

East-coast Australians know what unrelenting La Niña feels like. Climate change has loaded our atmosphere with moister air, while two summers of La Niña warmed the ocean north of Australia. Both contributed to some of the wettest conditions ever experienced, with record-breaking floods in New South Wales and Queensland.

Meanwhile, over the southwest of North America, a record drought and severe bushfires have put a huge strain on emergency services and agriculture, with the 2021 fires alone estimated to have cost at least US$70 billion.

Earth’s climate is dynamic, variable, and ever-changing. But our current trajectory of unabated greenhouse gas emissions is giving the whole system a giant kick that’ll have uncertain consequences – consequences that’ll rewrite our textbook description of the planet’s ocean circulation and its impact.


What is the Atlantic overturning meridional circulation?

The Atlantic overturning circulation comprises a massive flow of warm tropical water to the North Atlantic that helps keep European climate mild, while allowing the tropics a chance to lose excess heat. An equivalent overturning of Antarctic waters can be found in the Southern Hemisphere.

Climate records reaching back 120,000 years reveal the Atlantic overturning circulation has switched off, or dramatically slowed, during ice ages. It switches on and placates European climate during so-called “interglacial periods”, when the Earth’s climate is warmer.

Since human civilisation began around 5,000 years ago, the Atlantic overturning has been relatively stable. But over the past few decades a slowdown has been detected, and this has scientists worried.

Why the slowdown? One unambiguous consequence of global warming is the melting of polar ice caps in Greenland and Antarctica. When these icecaps melt they dump massive amounts of freshwater into the oceans, making water more buoyant and reducing the sinking of dense water at high latitudes.

Around Greenland alone, a massive 5 trillion tonnes of ice has melted in the past 20 years. That’s equivalent to 10,000 Sydney Harbours worth of freshwater. This melt rate is set to increase over the coming decades if global warming continues unabated.

A collapse of the North Atlantic and Antarctic overturning circulations would profoundly alter the anatomy of the world’s oceans. It would make them fresher at depth, deplete them of oxygen, and starve the upper ocean of the upwelling of nutrients provided when deep waters resurface from the ocean abyss. The implications for marine ecosystems would be profound.

With Greenland ice melt already well underway, scientists estimate the Atlantic overturning is at its weakest for at least the last millennium, with predictions of a future collapse on the cards in coming centuries if greenhouse gas emissions go unchecked.


The ramifications of a slowdown

In our study, we used a comprehensive global model to examine what Earth’s climate would look like under such a collapse. We switched the Atlantic overturning off by applying a massive meltwater anomaly to the North Atlantic, and then compared this to an equivalent run with no meltwater applied.

Our focus was to look beyond the well-known regional impacts around Europe and North America, and to check how Earth’s climate would change in remote locations, as far south as Antarctica.

The first thing the model simulations revealed was that without the Atlantic overturning, a massive pile up of heat builds up just south of the Equator.

This excess of tropical Atlantic heat pushes more warm moist air into the upper troposphere (around 10 kilometres into the atmosphere), causing dry air to descend over the east Pacific.

The descending air then strengthens trade winds, which pushes warm water towards the Indonesian seas. And this helps put the tropical Pacific into a La Niña-like state.

Australians may think of La Niña summers as cool and wet. But under the long-term warming trend of climate change, their worst impacts will be flooding rain, especially over the east.

We also show an Atlantic overturning shutdown would be felt as far south as Antarctica. Rising warm air over the West Pacific would trigger wind changes that propagate south to Antarctica. This would deepen the atmospheric low pressure system over the Amundsen Sea, which sits off west Antarctica.

This low pressure system is known to influence ice sheet and ice shelf melt, as well as ocean circulation and sea-ice extent as far west as the Ross Sea.

At no time in Earth’s history, giant meteorites and super-volcanos aside, has our climate system been jolted by changes in atmospheric gas composition like what we are imposing today by our unabated burning of fossil fuels.

The oceans are the flywheel of Earth’s climate, slowing the pace of change by absorbing heat and carbon in vast quantities. But there is payback, with sea level rise, ice melt, and a significant slowdown of the Atlantic overturning circulation projected for this century.

Now we know this slowdown will not just affect the North Atlantic region, but as far away as Australia and Antarctica.

We can prevent these changes from happening by growing a new low-carbon economy. Doing so will change, for the second time in less than a century, the course of Earth’s climate history – this time for the better.
NSW floods


Friday, April 29, 2022

Shifts in El Niño-La Niña cycle fuelling climate extremes

 From Inside Climate News


The record-breaking heat wave last week in East Antarctica, the coldest region on Earth, saw temperatures surge as much as 85 degrees Fahrenheit above average, bringing readings near freezing and unexpected surface melting instead of the usual sub-zero conditions.

The heat wave adds to a quickly growing list of previously “unthinkable” climate events, and puts an exclamation point on an Austral summer that included brutal heat waves and record-high intensity wildfires in Argentina and Chile and flooding caused by record-setting rains in eastern Australia that killed more than 20 people and left thousands homeless.

Other “unthinkable” extremes hit the Northern Hemisphere in the months before that. A December wildfire in the Rocky Mountain foothills of Colorado completely changed how some forest and fire scientists see the fire risk in that area, and the Pacific Northwest heat wave that started in June 2021 was an extreme not forecast by climate models. As that heat wave ebbed in July, parts of several German towns were destroyed by flooding rainstorms that were intensified by global warming. And in recent days, temperatures surged to 50 degrees Fahrenheit in the Siberian Arctic near the North Pole and above the adjacent Arctic Ocean.

Scientists exploring possible connections between the remarkable series of extremes in both hemispheres say they are increasingly certain that the powerful El Niño-La Niña cycle in the Pacific Ocean is one of the key links. New research shows the cycle has shifted in a way that is likely to fuel extremes, including wild swings between heat and drought and flooding rains.

In the El Niño/Southern Oscillation (ENSO), huge masses of water surge eastward and westward every two to seven years along a vast region of the equatorial Pacific. One of the strongest El Niños on record in 2016 helped boost the average global temperature to a new record high that year.

It’s Happening. Now. The most recent global science report from the Intergovernmental Panel on Climate Change projected that the global warming fingerprint on the El Niño-La Niña cycle would become apparent after about 2050. But the accelerating pace of record-breaking weather events shows that the destructive effects are already here, said Wenju Cai, director of the Center for Southern Hemisphere Oceans Research at the Commonwealth Scientific and Industrial Research Organisation in Australia.

Cai was a co-author on a key 2022 study showing that the western Pacific is warming more than the eastern Pacific and that the growing temperature contrast is driving complex changes to the El Niño cycle, but Cai said some key climate signals are emerging, including enhanced rainfall in the areas favored by the respective phases of the cycle. And along with the background global warming, each major El Niño peak since the 1950s has been stronger than the previous, pushing ocean surface temperatures to new highs in the east-central equatorial Pacific, where important climate measurements are made.

“Anything that happens in the tropics affects both the northern and southern hemisphere,” Cai said, adding that, as the El Niño/Southern Oscillation changes, the affected areas are expanding and the extremes are intensifying and lasting longer in both hemispheres.

How global warming changes the El Niño cycle is a “fundamental issue in climate science with critical societal ramifications” because the cycle is so important to driving climate extremes “within and outside the Pacific,” Cai and his co-authors wrote in the study, published in January in Nature Climate Change.

There is not yet a discernible direct link between the current La Niña phase of the cycle and the recent heat wave in the Antarctic: Researchers have not even begun to explore a connection. But the southern polar extreme happened just days after scientists announced the finding that Antarctic sea ice had plummeted to the lowest extent on record, leaving miles of open ocean that’s darker and warmer than a reflective ice shield. And recent research suggests that the El Niño cycle affects Antarctic ice shelves, with more melting from below in their floating sections, but also with increased snowfall on the surface that can thicken the ice.

The warm air streaming from the direction of Australia over East Antarctica also dumped record amounts of rain and snow, adding 65 gigatons of mass to the ice sheet in three days (March 16 to 18), said University of Liege polar researcher Xavier Fettweis.

“Usually, the climate of Antarctica is too cold to have significant accumulation of snow, and most of liquid water from melt or rainfall is absorbed by the snowpack and refreezes,” he said. Under very warm and wet air mass that moved over Antarctica “the ice sheet gained 69 gigatons in three days, three times the usual surface mass gain rate.”

During the El Niño phase of the cycle, warmer than average water sloshes toward the eastern equatorial Pacific, often spurring intense winter precipitation along the West Coast of North America and North America, with relatively cooler water in the western Pacific—conditions that contributed to the 2019-2020 Black Summer fires in Australia.

When the cycle flips to La Niña, as in the last couple of years, the eastern and central equatorial Pacific cool, and parts of the eastern Pacific, known as the ocean warm pool, heats up even more, with broad climate patterns favoring extremes like Australia’s March floods and drought in the southwestern United States.

Oceans hold 93 percent of the heat trapped by greenhouse gasses, and the tropical Pacific is the biggest tank for this heat, pure energy for the climate system. The El Niño-La Niña cycle is the pump distributing that energy, as heat and moisture, to the global climate system, to the east and west of the equator, as well as the north and south.

Matt England, who studies climate extremes at the University of New South Wales, said that even a decade ago he would not have expected to see impacts from the intensification of La Niña—like the March flooding in Australia—to show up so soon. But it’s not surprising that the effects are being felt in both hemispheres, he said.

“The ENSO cycle definitely involves large-scale reorganization of the global atmosphere, across both hemispheres, north and south, but also east and west,” England said, “It is one of the primary drivers of these climate extremes we’ve been seeing, the classic signature being floods and drought and fire,” shifting between the Americas and Indonesia, Australia and other western Pacific nations, depending on the phase of the cycle,” he added.

The north-south influence of a changing El Niño/Southern Oscillation cycle is harder to see, he said, “because ENSO is mainly about pushing water back-and-forth in an east and west sense along the tropical Pacific.”

Along with the east-west ocean shifts, ENSO generates huge areas of convective moist air that rise and shift around, almost like bubbles in a lava lamp. They’re big enough to push around wind belts that carry seasonal rain and snow storms and warm and moist enough to give those storms an extra kick, he said.

In one example of how the effects ripple globally in both hemispheres, the United States Agency for International Development (USAID), an independent U.S. government agency that delivers international aid, reported last month that La Niña and climate change are causing exceptional drought in East Africa,

England said that the effect on Antarctic sea ice is complex, and he noted that long-term climate records from the remote region are few and far between. But it appears that La Niña phases lead to a lower extent of sea ice. Stronger La Niñas could mean more years of record-low Antarctic sea ice, and every time that happens, the ocean warms a bit more, making it harder for the sea ice to form again the following winter, he added.

His advice: Hang on tight for the climate roller coaster ahead.

“Earth’s climate has ways of reorganizing itself in rapid and highly nonlinear ways and El Niño is part of that,” he said. “What concerns climate scientists is that these are not always small and gradual shifts.”


Saturday, January 29, 2022

Last 7 years hottest ever

 From NOAA

Source: NOAA

Cooler than it was in 2020, because it was a La Niña year.  A fair bit cooler than 2016, an El Niño year, when the Pacific gives up some of the heat it has absorbed during the La Niña.  Still, the last 7 years have been the warmest measured by thermometer in the last nearly 150 years, and, using numerous proxy measurements, the hottest in the last 2000.  Temperatures will drop over the next couple of years because of the massive eruption of the volcano in Tonga.  No doubt, denialists will have a field day, pointing out that temperatures have fallen since 2016.   After all, after the last big El Niño in 2008, they dined out for years on the fact that temperatures had "stopped rising", ignoring the ENSO  (El Niño- Southern Oscillation) cycles.


Monday, August 2, 2021

A wet winter, a soggy spring: the Indian Ocean dipole

 From The Conversation:


This month we’ve seen some crazy, devastating weather. Perth recorded its wettest July in decades, with 18 straight days of relentless rain. Overseas, parts of Europe and China have endured extensive flooding, with hundreds of lives lost and hundreds of thousands of people evacuated.

And last week, Australia’s Bureau of Meteorology officially declared there is a negative Indian Ocean Dipole — the first negative event in five years — known for bringing wet weather.

But what even is the Indian Ocean Dipole, and does it matter? Is it to blame for these events?

The Indian Ocean Dipole, or IOD, is a natural climate phenomenon that influences rainfall patterns around the Indian Ocean, including Australia. It’s brought about by the interactions between the currents along the sea surface and atmospheric circulation.

It can be thought of as the Indian Ocean’s cousin of the better known El Niño and La Niña in the Pacific. Essentially, for most of Australia, El Niño brings dry weather, while La Niña brings wet weather. The IOD has the same impact through its positive and negative phases, respectively.

Positive IODs are associated with an increased chance for dry weather in southern and southeast Australia. The devastating Black Summer bushfires in 2019–20 were linked to an extreme positive IOD, as well as human-caused climate change which exacerbated these conditions.

Negative IODs tend to be less frequent and not as strong as positive IOD events, but can still bring severe climate conditions, such as heavy rainfall and flooding, to parts of Australia.


The IOD is determined by the differences in sea surface temperature on either side of the Indian Ocean.

During a negative phase, waters in the eastern Indian Ocean (near Indonesia) are warmer than normal, and the western Indian Ocean (near Africa) are cooler than normal.

This causes more moisture-filled air to flow towards Australia, favouring wind pattern changes in a way that promotes more rainfall to southern parts of Australia. This includes parts of Western Australia, South Australia, Victoria, NSW and the ACT.

Generally, IOD events start in late autumn or winter, and can last until the end of spring — abruptly ending with the onset of the northern Australian monsoon.


We probably have a wet few months ahead of us.

The negative IOD means the southern regions of Australia are likely to have a wet winter and spring. Indeed, the seasonal outlook indicates above average rainfall for much of the country in the next three months.

In southern Australia, a negative IOD also means we’re more likely to get cooler daytime temperatures and warmer nights. But just because we’re more likely to have a wetter few months doesn’t mean we necessarily will — every negative IOD event is different.

This is the first official negative IOD event since 2016, a year that saw one of the strongest negative IOD events on record. It resulted in Australia’s second wettest winter on record and flooding in parts of NSW, Victoria, and South Australia.

The 2016 event was also linked to devastating drought in East Africa on the other side of the Indian Ocean, and heavy rainfall in Indonesia.

Thankfully, current forecasts indicate the negative IOD will be a little milder this time, so we hopefully won’t see any devastating events.

The IOD — as well as El Niño and La Niña — are natural climate phenomena, and have been occurring for thousands of years, before humans started burning fossil fuels. But that doesn’t mean climate change today isn’t having an effect on the IOD.

Scientific research is showing positive IODs — linked to drier conditions in eastern Australia — have become more common. And this is linked to human-caused climate change influencing ocean temperatures.


Climate models also suggest we may experience more positive IOD events in future, including increased chances of bushfires and drought in Australia, and fewer negative IOD events. This may mean we experience more droughts and less “drought-breaking” rains, but the jury’s still out.

When it comes to the recent, devastating floods overseas, scientists are still assessing how much of a role climate change played.

But in any case, we do know one thing for sure: rising global temperatures from climate change will cause more frequent and severe extreme events, including the short-duration heavy rainfalls associated with flooding, and heatwaves.

To avoid worse disasters in our future, we need to cut emissions drastically and urgently.


Thursday, July 8, 2021

North America has hottest June on record

In a La Niña year, too.

From The Guardian 


North America endured the hottest June on record last month, according to satellite data that shows temperature peaks lasting longer as well as rising higher. The heat dome above western Canada and the north-west United States generated headlines around the world as daily temperature records were shattered across British Columbia, Washington and Portland.

The new data reveals this was part of a broader trend that built up over several weeks and a far wider area, which is underpinned by human-driven climate disruption.

The European Union’s Copernicus Climate Change Service also revealed that June temperatures in North America were 1.2C higher than the average from 1991 to 2020, which is more than 2C above pre-industrial levels.

This is the 12th consecutive year of above-average June temperatures in the region, and the greatest increase recorded until now.

At the start of the month, the record-breaking heatwave conditions were centred over the south-west of the US. They then moved over the north-west of the US and south-west Canada, causing more than 500 heat-related deaths and creating tinder for wildfires. The town of Lytton in British Columbia broke Canada’s heat record three days in a row. The latest hydrological bulletin shows many of the affected regions had unusually dry soil.

Northern Europe and Siberia also experienced an unusually hot June. Temperature records were broken in Moscow and Helsinki. The world as a whole was also warmer than average for this time of year. This would not normally be expected in the same year as a La Niña phenomenon, which is generally associated with a cooling effect.


Monday, May 17, 2021

Australian coal use hits record low

 From The Age

Coal-fired power consumption in Australia hit a record low [i.e., since the formation of the national electricity market 25 years ago] during the first three months of 2021 and gas generation crashed to the lowest level in 15 years, as renewable energy and falling prices continue to shake up the market.

Figures from the Australian Energy Regulator, released on Monday, shed light on the impact of the clean energy transition sweeping the country’s main power grid and the existential challenges engulfing fossil-fuel generators.

Coal generation for the quarter dropped by 800MW, accounting for just 15,000MW: its lowest proportion since the formation of the National Electricity Market in the late 1990s.

During the past March quarter, usually the most energy-intensive period, the development of large wind and solar farms, greater output from rooftop solar panels and milder-than-usual weather [thanks to La Niña] slashed prices across the National Electricity Market. The Victorian wholesale price fell the most sharply, to $27 a megawatt-hour from more than $100 the same time last year.

“In summer, and particularly the first quarter, wholesale electricity prices are usually higher with hot weather prompting more use of air conditioners, and higher demand for electricity pushing up prices,” Australian Energy Regulator chair Claire Savage said. “But the first quarter this year was different.”

Rock-bottom wholesale electricity prices – which Ms Savage described as “good news for consumers” because they would eventually translate to lower bills – have been piling enormous pressure on coal-fired generators, which supply the bulk of the country’s power but are now running at a loss and are unable to compete with cheaper renewables during the day.

The chair of the Commonwealth’s Energy Security Board, Kerry Schott, last month said “the economics of coal is that nobody will build it” and the expected end of the life spans of existing plants were approaching faster than anyone had previously anticipated.


(Source of charts below: AER.  Solar chart excludes rooftop solar which is now 3 GW of capacity nationally compared with 5 GW of grid-scale solar.   Including rooftop solar, South Australia must be at ~60% total wind and solar in the latest data)


Solar as % of regional output


Wind as % of regional output