Showing posts with label wind plus solar. Show all posts

Saturday, June 13, 2026

Wind and solar generate more than gas

 From Canary Media


It’s the first month [ever] [that] wind and solar [have] combined to produce more electricity than natural gas did, per new global data from energy think tank Ember.

Just five years ago, the gap between what those renewable resources and gas generated was huge. Even in the best month for renewables, gas plants churned out about twice as much power. Now, the picture is very different: Wind and solar generated about 532 terawatt-hours of electricity [+13.4% yoy] worldwide last month, while gas contributed just 477 TWh [-3.9%].  

This won’t be the first time wind and solar outcompete gas on the global stage.

Last year, the world met 75% of its new electricity demand with solar alone, and the remainder with other forms of carbon-free energy. The result? Fossil-fuel power generation declined — very slightly — even though the world consumed more electricity.

Meanwhile, the ongoing war in the Middle East bolsters the case for renewable energy. Iran’s blockade of the Strait of Hormuz and its retaliatory strikes on Qatar forced one-fifth of the global liquefied natural gas export capacity offline earlier this year, causing supply shortages and price spikes for the many countries that depend on imported, rather than domestic, natural gas.

Already, some nations appear to have increased their adoption of renewables to shore up their national energy security.

The caveats of the April milestone must be mentioned. It’s just one month — and occurred during the shoulder season, the best time of the year for renewables, as breezes pick up and days get sunnier [in the northern hemisphere, it's winter in the southern.  The seasonal cycles obvious in the data are because the northern hemisphere has more land and more people than the southern]

Then there’s King Coal, which still produces far more electricity worldwide than wind and solar. But it’s clear where we’re headed. The share of coal-fired electricity actually fell by half a percentage point from 2024 to 2025, marking the first annual drop since Covid and the first time in history that the dirty fuel produced less than a third of the world’s power. [Just as important: wind plus solar plus other renewables (mostly hydro) provided more electricity in April (925 TWh) than coal (758 TWh).]

In other words, coal should watch its back: It’s only a matter of time before wind and solar come for its crown, too.

Friday, June 12, 2026

Super fast growth in wind and solar

 From Gavin Mooney


Wind and solar generation is scaling faster than any other electricity sources in history.

This chart looks at the time taken for different technologies to grow from 100 TWh to 1,000 TWh of annual electricity generation.

✅ Solar took just 8 years
✅ Wind took 12 years
✅ By comparison, gas took 28 years, coal 32 years and hydro 39 years

Nuclear also reached the milestone in 12 years, but then its growth slowed sooner than wind.

Importantly, this chart is not measuring market share. It is measuring how quickly different technologies scaled once they reached meaningful levels of deployment.

And the story today is also bigger than generation alone.

Batteries are increasingly extending solar generation into the evening peak, while electrification is creating new demand for clean electricity in transport, heating and industry.

Much of this growth is being driven by improving economics, with wind, solar and batteries becoming increasingly competitive across a growing range of applications.

That combination is beginning to reshape energy systems around the world.

Renewables now generate more than one third of global electricity, and wind and solar continue to account for the majority of new power capacity added each year.

The pace of deployment matters because energy transitions are ultimately about scale. And by that measure, wind and solar are growing faster than anything that came before them.


Thursday, May 29, 2025

Wind + Solar provide 26% of China's electricity

 From Nicholas Fulghum

Wind and solar generated more than a QUARTER of China's electricity for the first month on record In April 2025, 26% of China's electricity generation was produced by wind and solar according to our latest data. Wind: 13.6% Solar 12.4%


As the EMBER piece says: 


The April record was driven by both wind and solar hitting individual record high shares. Wind power accounted for 13.6% of generation while solar contributed 12.4%. The rise of solar power in particular has been remarkable. The share of solar power has tripled in the last five years, from just 4.1% in April of 2020. In 2024, China installed more new solar capacity than the rest of the world combined, more than tripling its rate of installations in just two years, from around 103 GW (DC) in 2022 to 333 GW in 2024. Installations have continued at pace in 2025, with 72 GW of new solar added in Q1 alone, up 18% from Q1 2024, according to Ember’s monthly wind and solar capacity data.

The rapid build out of solar capacity in China has pushed not only the share, but also absolute solar generation to new heights. In April 2025, China hit a new record of 96 TWh of solar generation, surpassing the previous record of 89 TWh set in August of 2024. This record may soon be surpassed again as summer conditions further boost output. 

The growth in renewables is also reshaping the overall generation mix. Fossil fuel generation has already declined by 72 TWh—or 3.6%—year-on-year across the first four months of 2025, a shift that’s beginning to show structural signs.


The rate at which wind and solar are increasing means the rise in output from renewables now exceeds the rise in total demand (current running at +-3% per annum), even with electricity demand increasing because of EVs and PHEVs.   Which means, in turn, that China's emissions have peaked.  

Caveats:  growth may soar this year or next, or, for some inexplicable reason, wind and solar will stop growing.  Solar panels continue to decline in cost, and battery costs are falling even faster, meaning solar can be "firmed" easily and cheaply, so solar, at least, is likely to continue growing fast. 

  Note how wind and solar have different seasonal patterns, which means that, combined, less of both is required.  For now, gas will still be required to balance the grid when renewables are low, but the rise in EVs/PHEVs and falling capacity utilisation at coal power stations, means that China has passed peak coal and peak oil.   Since China produces +-25% of the world's emissions, that may mean that world emissions have also peaked. 


Wednesday, April 16, 2025

US wind and solar now 25% of all electricity

From John Hanger


Good morning with good news: US wind & solar surge, generating 83 TWh in March 2025, up ~20% from 69 TWh in March 2024.

W&S were 24.38% of US electricity in March 2025 March W&S generation: 2025 83 TWh 2024 69 TWh 2021 52 TWh 2020 39 TWh 2015 18 TWh 4X since 2015 & 2X since 2020!


Everywhere you look, you can see wind, or solar, or wind and solar rising steadily.  In some countries, it will reach its markets share, i.e., whatever is left over after hydro and nuclear with a few years, in others it will take longer.  But we're getting there.

Tuesday, January 7, 2025

Kicking fossil fuel out of industry

 From Just Have a Think


Gives an interesting perspective of just how fossil fuels are used in industry, and how we can replace almost all uses with green electricity.  As so often, up-front costs are key.  And as always, a decent carbon price would encourage a more rapid transition to carbon-free industry.

There are 4 main "sectors" where we need to de-carbonise, and they each require different solutions.  The emissions from each sector are not equal, but it helps to break down the problem like this.

  1.  Electricity generation.  This is, globally, the sector with the biggest share of emissions, but that varies a bit depending on the country.  The solutions here are obvious, and happening, though not as fast as is needed.
  2. Transport.  A mixed bag.  Land transport is moving rapidly towards zero carbon; air and sea transport still has a long way to go.
  3. Industry.  This includes steel and cement production, and chemicals and paper.  This video discusses various solutions.
  4. Food.  A combination of methane emissions by grazing animals, and deforestation to produce beef.  As big as electricity generation by many analyses, but the hardest to reduce, because people have an emotional relationship with their food.  Politicians interfere at their peril, so shy away.  Yet it is abundantly clear that something will have to be done.


Friday, February 16, 2024

Solar to pass hydro this year in the USA


From Electrek


The US Energy Information Administration (EIA) expects annual solar generation to surpass annual hydropower generation in 2024 for the first time.

The EIA’s “Short-Term Energy Outlook,” released today, forecasts that the US will generate 14% more solar electricity than hydropower in 2024. That’s based on continued growth in new utility-scale and small-scale (e.g., rooftop) solar.

From 2009 to 2022, installed US solar capacity increased at an average rate of 44% annually, and installed US hydropower increased by less than 1% annually. In 2019, annual wind generation surpassed annual hydropower generation. The growth of US solar and wind are following a similar pattern, largely following an increase in installed capacity.

Incentives such as tax credits created by the Inflation Reduction Act have ramped up growth in renewable generation capacity. By August 2023, installed US solar capacity totaled more than 125 gigawatts (GW), including 80 GW of utility-scale solar and around 45 GW of small-scale solar. US hydropower has remained relatively steady at about 80 GW for the past few decades.

Weather patterns reduced US hydroelectric generation through August this year. Hydropower generation depends on seasonal hydrologic conditions and long-term weather trends. Although weather patterns also affect solar and wind, the most significant contributor to their additional generation is because they’ve had the fastest growth in generating capacity.


So, wind and solar now both, by themselves, produce more electricity than hydro.  And this trend will only continue.

Tuesday, August 22, 2023

The IPCC's path to radically lower emissions


From The Guardian


It feels impossible. The world has to slash carbon emissions by almost half in the next seven years to remain on track for just 1.5C of global heating and avoid the worst of climate impacts. Yet emissions are rising.

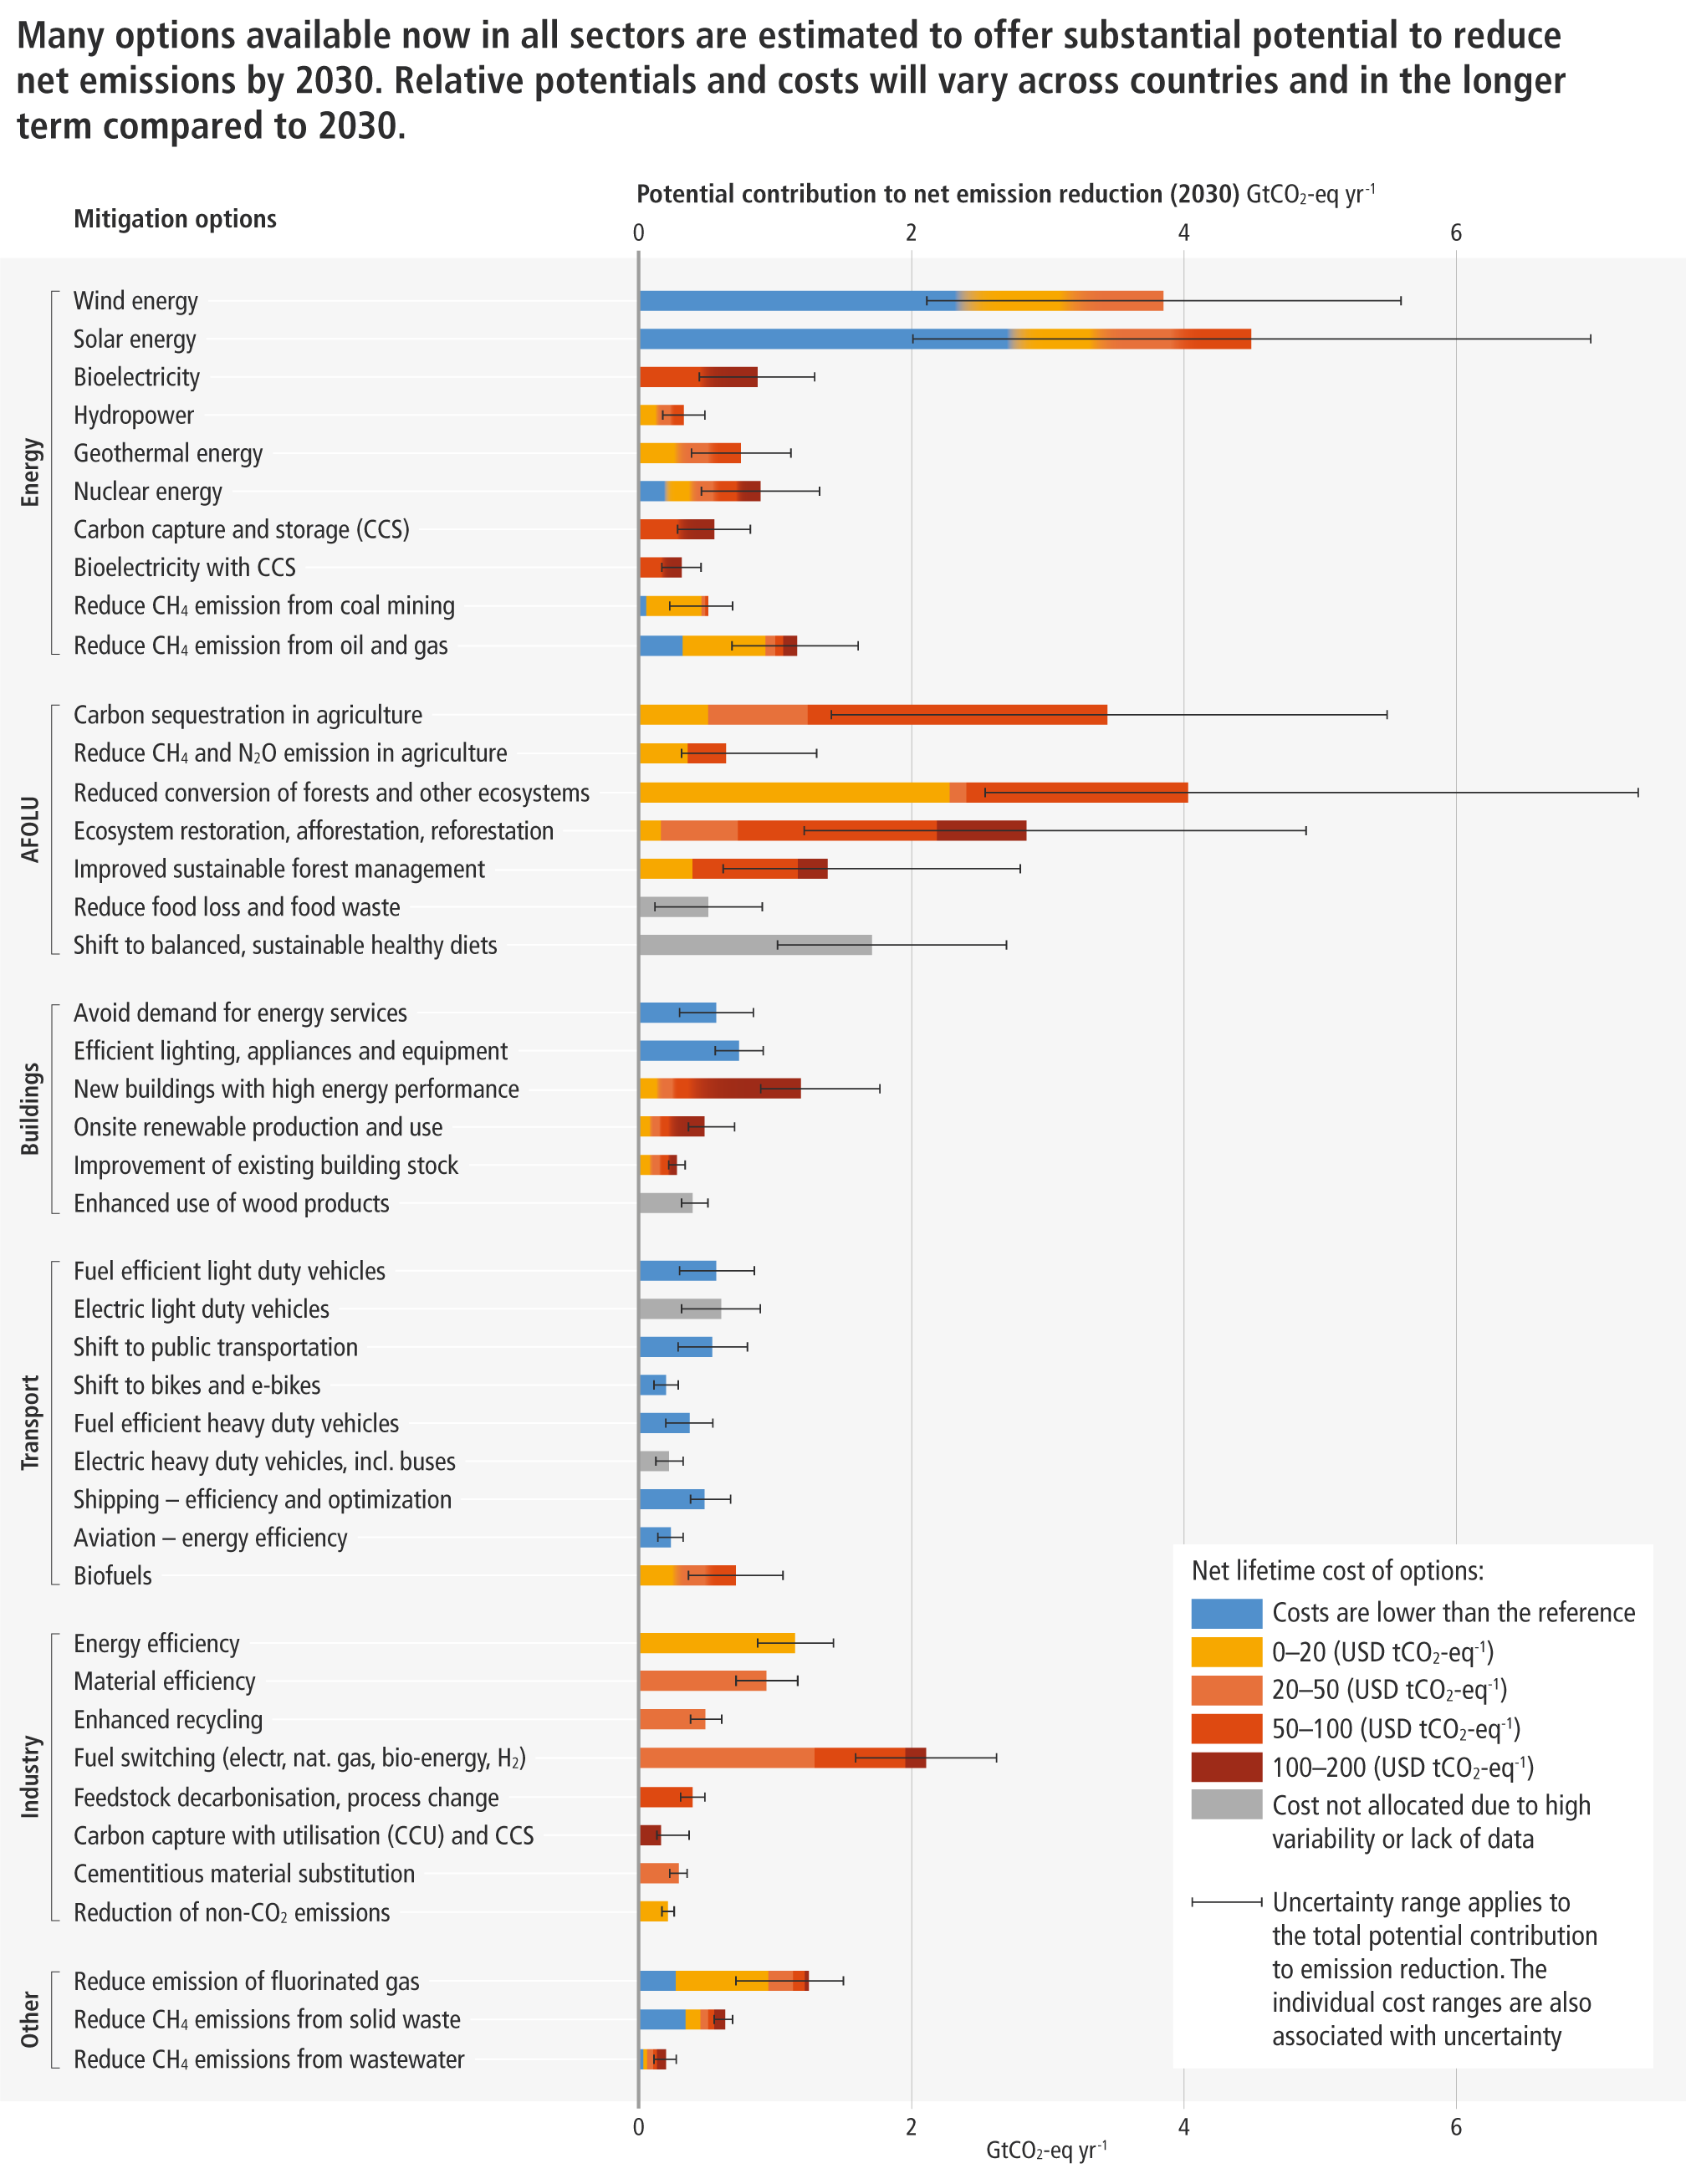
However, tucked away in the recent (and devastating) landmark report from the Intergovernmental Panel on Climate Change (IPCC) is a chart that provides the road map for an escape from catastrophe. It assesses with extraordinary clarity the potential for emissions cuts of more than 40 options. You can view it here.

The simplicity of the chart is deceptive. It was compiled by a team of the world’s best scientists, based on 175 studies. Its power is amplified by the fact that it was signed off by all of the world’s governments, from the cleanest and greenest to the darkest petrostates.

So what does it show? First, solar and wind power are by far the best option, with the potential to cut a staggering 8bn tonnes from annual CO2 emissions by 2030. That is equivalent to the combined emissions of the US and European Union today. Even more startling is that most of that potential can be achieved at lower cost than just continuing with today’s electricity systems.

“What struck me especially was that wind and solar was so big,” Prof Kornelis Blok, at Delft University of Technology in the Netherlands, told me this week. Blok, who led the work on the chart, identified the winners: “The big five are wind, solar, energy efficiency, stopping deforestation and reducing methane emissions.”

Just as important as the winners in this analysis are the losers. Nuclear power and carbon capture and storage (CCS) each have just 10% of the potential of wind and solar, and at far higher cost. The same applies to bioenergy – burning wood or crops for electricity. It’s no wonder that the UK’s energy strategy, published last week, received significant criticism: it goes heavy on nuclear and CCS, while ignoring onshore wind.

After wind and solar, the biggest prize is stopping the destruction of forests and other wild places, the IPCC scientists found. That has the potential to cut 4bn tonnes of emissions a year by 2030, not far off double the fossil fuel emissions from the whole of Africa and South America today. Including the restoration of degraded forests adds almost 3bn tonnes. Much of this could be achieved for less than $50 per tonne – half the price polluters pay for carbon permits in Europe today.

Energy efficiency in buildings, industry, lighting and appliances remains a no-brainer – 4.5bn tonnes a year by 2030 – as does slashing methane emissions, particularly from leaky fossil fuel installations. The latter could save the equivalent of about 3bn tonnes.

There are some interesting details too. A shift to “sustainable diets” – ie eating much less red meat in rich nations – could cut 1.7bn tonnes of emissions, equivalent to all the annual pollution from fossil fuel giant Russia. A push towards public transport, bikes and e-bikes has the potential to cut emissions more than the rollout of electric cars, showing both are needed. An often overlooked option – burying charcoal in fields (biochar) – is relatively costly to implement but potentially huge. Along with avoiding the ploughing of fields, which releases carbon, biochar could save 3.4bn tonnes of CO2 a year.

The IPCC chart is a map of climate optimism. It shows we can cut emissions by half by 2030 with options costing at most $100 per tonne, which is a bargain when set against the further damages that climate inaction will inevitably bring.

The solutions – wind, solar, trees, energy saving and methane cuts – require no new technology. But what they do require is a resource heavily lacking so far: the political will to push aside vested interests and rapidly pursue the policies that will work.

“The chart is a very useful hitlist,” says Blok. “I think every country can take it and see in which areas they could do more. If we don’t achieve [a 50% cut in emissions by 2030], it will not be because of a lack of options.”


To sum up:

  • Solar and wind are the biggies; nuclear and CCS are more or less irrelevant
  • Stop clearing forests
  • Restore degraded forests
  • Energy efficiency 
  • Slashing methane emissions
  • Eating less meat
  • A shift towards public transport, bikes and e-bikes
  • EVs
  • Biochar

Click on chart to see clearer image


Monday, March 13, 2023

The smartest renewable rooftop system

From Just Have a Think


 A rooftop combine wind and solar system with twice the efficiency of normal rooftop solar and 6 to 10 times the efficiency of small wind turbines.  Very interesting.


My comments:

  • Because the solar panels are bifacial and all the equipment is painted white to reflect as much of the light back up to the underside of the panels, and because the cooling wind under the panels stops the panels heating up on sunny days, the efficiency of the solar is double the norm for rooftop solar.
  • The "roof" of panels and the arrangement of wind turbines focusses the air flow, making these wind turbines exceptionally efficient.  Rooftop small wind turbines are not nearly as efficient as giant turbines, making home wind turbines uneconomic.
  • The LCOE  over 25 years is 8 to 12 cents per kWh.  That's more expensive than the LCOEs of utility-scale wind and solar, but this system is competing with the retail cost of electricity, not the wholesale price.  The average retail price of electricity in Europe is over $0.25 cents per kWh (including taxes); in the US it was around 11 cents/kWh in 2021, before gas prices jumped in response to Russia's invasion of Ukraine, and in Australia, the average retail price of electricity was (US) 19 cents/kWh.  
  • The Eindhoven installation provides 85% of the building's energy requirements.  If the building were 2 or 3 stories shorter, it would be 100%.
  • These distributed generation facilities should benefit the residents of the building, but ownership of the machinery belongs either to the landlord of the building or to the body corporate.  This complication will have to be resolved for this to work, given the retail/wholesale price difference.
  • Wind and solar together go far towards producing a stable baseload electricity output.  Adding in 4 hours of storage would make it even better.  Charging the residents' EVs when there is surplus power available would make the building and its occupants more or less independent of the grid.
  • A very clever system which would be worth installing on all buildings of 4 storeys or more with flat roofs.