

Follow me on Mastodon: https://mstdn.social/@Nigel_Purchase
Friday, December 30, 2016
Thursday, December 29, 2016

Wednesday, December 28, 2016

India won't save coal
India plans nearly 60% of electricity capacity from non-fossil fuels by 2027
Is the Indian coal domino about to fall?
[Read more here and here]
The Indian government has forecast that it will exceed the renewable energy targets set in Paris last year by nearly half and three years ahead of schedule.
A draft 10-year energy blueprint published this week predicts that 57% of India’s total electricity capacity will come from non-fossil fuel sources by 2027. The Paris climate accord target was 40% by 2030.
The forecast reflects an increase in private sector investment in Indian renewable energy projects over the past year, according to analysts.
The draft national electricity plan also indicated that no new coal-fired power stations were likely to be required to meet Indian energy needs until at least 2027, raising further doubts over the viability of Indian mining investments overseas, such as the energy company Adani’s Carmichael mine in Queensland, the largest coalmine planned to be built in Australia.
Is the Indian coal domino about to fall?
The up-beat claim by the coal lobby that Indian coal power will keep growing for decades has been sorely tested in 2016, as the country’s power sector is rapidly shifting towards renewables, even as public opposition to air pollution, displacement and deforestation for coal mining grows. India’s coal power boosters are now confronting an increasing array of signals which suggest the diversification away from coal will only accelerate in 2017.
Between April and October this year the Central Electricity Agency (CEA) reports India has commissioned (p. 5) just over 3600 megawatt of coal plant capacity, down almost by half on the year before. While the financial year still has four months to run, the coal sector may well fall short of the 13,000 MW of new plants expected to be commissioned this [financial] year.
Massive stockpiles of coal at mines and power plants due to reduced demand for power have forced a slowing of mine production, which has remained relatively flat over 2015. To cap it all off, coal plant utilisation rates continue to fall year on year, and are hovering below 60% for the April-October 2016 period.
Over the same period the combined generation of wind and solar grew by over 43 per cent compared to the year before, massively outpacing the growth rate for thermal power. While generation from conventional sources – predominantly coal – grew by a larger amount in absolute terms, renewable generation’s growth at over six times the rate of conventional sources is none-the-less hugely significant. In all, 28% or over a quarter of all new generation between April and October 2016 came from renewable sources.
This week the CEA revealed in its draft National Electricity Plan (NEP) that for the five years to 2022 the country does not require any more coal-based capacity addition till 2022 above current levels. As expected, given India’s severe energy shortage and millions without electricity, the plan’s estimated growth of 187,000 megawatts (MW) in new capacity between 2017 and 2022 is huge. But the critical point is that the bulk of this – 115,000 MW – consists of renewables.
The draft NEP is clear that there is no need for a single additional MW of coal power till 2022. Moreover, considering the over 50,000 MW currently under construction, likely to come on stream in the next few years, there is also no need for additional coal power plants till 2027. This in effect signals that there is no need for a single new coal power plant to be approved, receive finance, be granted permits or break ground in India for the foreseeable future – if ever!
[Read more here and here]

Monday, December 26, 2016

Sunday, December 25, 2016
Is it the sun?
There are some denialists who maintain that the world is getting warmer because the sun is hotter, and that rising global temperatures have nothing to do with the CO2 released into the atmosphere over the last couple of hundred years from the burning of fossil fuels.
The chart below shows how silly this claim is. You can see the fairly regular solar cycle (yellow line) and you can also see how it coincides, more or less, with "bulges" in the upward trend of global temperatures. Note how (a) the sun's cycle has been relatively weak over the last few years and (b) how the relationship between the solar cycle and the fluctuations around the rising temperature trend in recent years looks much less robust. OK, I'm just looking at the chart, and not doing a statistical analysis, so I merely offer the observation. I also offer the observation (again without doing any statistical analysis) that the temperature line (grey) appears to fit very well indeed with the CO2 lines (blue Mauna Loa, green ice core) allowing for cyclical and random fluctuations in temperature. One obvious cycle is ENSO (El Niño/Southern Oscillation) which raised temperatures in 1998 and again last year. With the latest El Niño over, the temperature anomaly will slip back towards the CO2 line. And it will likely (by the looks of things) coincide with a cooler sun. But that will be temporary only. The slope of the CO2 line is increasing. The fundamental driving force, rising CO2 level in the atmosphere, will dominate again, and God help us if there is another El Niño.
[Read more here]
 |
| (Source) |
Saturday, December 24, 2016

The inexorable rise of renewables
Across the world, renewables are now cheaper than coal. Across the world, renewables are replacing coal.
Here from the heart of America is yet more evidence of the inexorable rise of renewables and the fall of coal.

Wind generation has grown by more than 11 million megawatt-hours (MWh) in just a year in the huge ERCOT market of Texas.
The increase, which has driven wind’s share of generation to 48 million MWh in the first 11 months of 2016 from 36 million MWh in the first 11 months of 2015, has displaced over 11.6 million MWh of electricity that would otherwise have been produced at fossil-fired plants.
A similar shift is occurring across the vast region of middle America served by the Southwest Power Pool (SPP), an area known also as the Saudi Arabia of wind. It includes all or most of Kansas, Nebraska, North Dakota, Oklahoma, South Dakota, and significant chunks of other states.
SPP reported having more than 12,000 megawatts of wind capacity in service this year, with as much as an additional 4,000 expected to come online soon.
More than 33,000 megawatts of wind projects are in various stages of development across the region, which—as SPP itself has said—has “more potential wind energy in [its] footprint than SPP could absorb.”
It’s an export industry in the making.
[Read more here]
Trump and his Troglodytes may be successful in removing the 30% tax credit that helps support the switch to renewables. But I doubt it: there are too many jobs in wind now, more than in oil and coal, and too many Republican states which benefit from wind. But even if he did, wind power is cheaper than coal and gas even without the tax credit. And it will continue to get cheaper.
And China and India aren't going to stop their switch to renewables, either. It's happening.
Here from the heart of America is yet more evidence of the inexorable rise of renewables and the fall of coal.
Wind generation has grown by more than 11 million megawatt-hours (MWh) in just a year in the huge ERCOT market of Texas.
The increase, which has driven wind’s share of generation to 48 million MWh in the first 11 months of 2016 from 36 million MWh in the first 11 months of 2015, has displaced over 11.6 million MWh of electricity that would otherwise have been produced at fossil-fired plants.
A similar shift is occurring across the vast region of middle America served by the Southwest Power Pool (SPP), an area known also as the Saudi Arabia of wind. It includes all or most of Kansas, Nebraska, North Dakota, Oklahoma, South Dakota, and significant chunks of other states.
SPP reported having more than 12,000 megawatts of wind capacity in service this year, with as much as an additional 4,000 expected to come online soon.
More than 33,000 megawatts of wind projects are in various stages of development across the region, which—as SPP itself has said—has “more potential wind energy in [its] footprint than SPP could absorb.”
It’s an export industry in the making.
[Read more here]
Trump and his Troglodytes may be successful in removing the 30% tax credit that helps support the switch to renewables. But I doubt it: there are too many jobs in wind now, more than in oil and coal, and too many Republican states which benefit from wind. But even if he did, wind power is cheaper than coal and gas even without the tax credit. And it will continue to get cheaper.
And China and India aren't going to stop their switch to renewables, either. It's happening.
Thursday, December 22, 2016

Monday, December 19, 2016
PMIs show world econ picking up
This is the GDP-weighted average for the PMIs ("purchasing manager indices") for Europe, the US and Japan. The latest observation is based on preliminary not final data. (Markit no longer releases prelim figures for China.) This the first real synchronised pick-up in major world economies/regions since the euro crisis. For the first time since then we're seeing a recovery in Europe as well as a pick up in the US and Japan. And this acceleration is before the surge which will come from the Trump spending and tax cuts.


Trump, Putin and the pipelines to nowhere
 |
| (Source) |
[Read more of this extremely interesting article here]
Here’s the blunt reality: the pressure to cut emissions and respond to a changing climate are going to alter what we do and don’t see as valuable. Climate action will trigger an enormous shift in the way we value things.
If we can’t burn oil, it’s not worth very much. If we can’t defend coastal real estate from rising seas (or even insure it, for that matter), it’s not worth very much. If the industrial process a company owns exposes them to future climate litigation, it’s not worth very much. The value of those assets is going to plummet, inevitably… and likely, soon.
Currently, though, these assets are valued very highly. Oil is seen as hugely valuable, coastal real estate is seen as hugely valuable, industrial patents are seen as hugely valuable.
When there’s a large difference between how markets think assets should be valued and what they are (or will) actually be worth, we call it a “bubble.”
Experts now call the differences between valuations and worth in fossil fuel corporations, climate-harmful industries and vulnerable physical assets the “Carbon Bubble.” It is still growing.
And here’s the thing about bubbles: they always pop.
As it becomes clear that these assets will not produce profit in the future, their valuations will drop — even if the businesses that own them continue to function for years. The value of oil companies will collapse long before the last barrel of oil is burned; the value of beachfront hotels will collapse long before rising tides flood their lobbies.
Put another way: The pop comes when people understand that growth in these industries is over and that, in fact, these industries are now going to contract. That’s when investors start pulling out and looking for safer bets. As investors begin to flee these companies, others realize more devaluation is on the way, so they want to get out before the drop: a trickle of divestment becomes a flood and the price collapses. What triggers the drop is investors ceasing to believe the company has a strong future.
Because that risk already exists, the pop is way closer than most people understand.
A crisis in investor confidence is the biggest threat to fossil fuel companies — not environmentalists, regulations, clean energy competitors or climate agreements.
For high-carbon industries to continue to be attractive investments, then, they must spin a tale of future growth. They must make potential investors believe that even if there is a Carbon Bubble, it is decades away from popping — that their high profits today will continue for the foreseeable future, so their stock is worth buying.
How would you maintain this confidence?
- You’d dispute climate science — making scientists’ predictions seem less certain in the public mind— and work to gut the capacity of scientists to continue their work (by, for instance, defunding NASA’s Earth Sciences program).
- You’d attack global climate agreements, making them look unstable and weak, and thus unlikely to impact your businesses.
- You’d attack low-carbon competitors politically, attempting to portray the evidence that they can replace high-carbon industries as fraudulent (or at least overly idealistic).
- You’d use every leverage point to slow low-carbon industrial progress — for example, by continuing massive subsidies to oil and gas companies, while attacking programs to develop new energy sources.
- You’d support putting a price on carbon, since this makes you look moderate and engaged, but you’d make sure that the definition of a “reasonable” price on carbon was so low and took so long to implement that it was no real threat to your business, and at worst would replace the dirtiest fossil fuels with others (switching for example from coal to gas).
- You would ally with extremists and other sources of anti-democratic power, in order to be able to fight democratic efforts to cut emissions through the application of threats, instability and violence.
- Most of all, you’d invest as heavily as possible in new infrastructure and supply. For oil and gas companies, this means new exploration and new pipelines. Why would you do this, if you know you may have to abandon these assets before they’ve paid off? Two reasons: First, it sends a signal of confidence to markets that you expect to continue to grow in the future. Second, it’s politically harder to force companies to abandon expensive investments than it is to prevent those systems from being built in the first place — the mere existence of a pipeline becomes an argument for continuing to use it. This, too, bolsters investor confidence. (Note that whether these assets are eventually abandoned or not is of little concern to current investors looking to delay devaluations).
Here’s the kicker: If you were going to put in place a presidential administration that was dedicated to taking these actions, it would look exactly like what we have now: a cabinet and chief advisors in which nearly every member is a climate denialist with ties to the Carbon Lobby.
No One Cares More about the Carbon Bubble than Putin. Trump’s ties to Russian espionage suddenly make more sense in this light. If you were going to ask why a country like Russia would risk a war to interfere with American politics, look at what the Russian economy is.
Russia is a petrostate. It’s the number one gas exporter and number two oil exporter in the world, but it’s economy is otherwise stagnant and out-of-date. Those oil and gas assets are controlled by a small number of oligarchs gathered around Putin, the former head of the KGB. Those oligarchs may be the one group of investors who stands to lose the most from the popping of the Carbon Bubble.
This is a most interesting article. I urge you to read in in full. It explains very clearly that the denialists are neither quixotic nor demented. They know exactly what they're doing. And they want us to pay, through financial losses and climate disasters.
We must not let them get away with it.
Sunday, December 18, 2016
Global Temperatures
This eye-catching chart is from this article on Phys.org. The article says that a warm climate is more sensitive to changes in atmospheric CO2. Which means that a given rise in atmospheric CO2 raises global average temperatures more when the temperature itself is higher. Not good news. I added the red dot, which shows where the global temperature anomaly is likely to be on the same scale as the long-term section of the chart on the left. Click to enlarge. [Hat tip to JPratt27]


Thursday, December 15, 2016

Dirt cheap solar, even in Denmark
 |
| (Source) |
Even in Denmark, latitude 55 deg N, solar is cheap. We've got used to cheap solar in places like Dubai or the US south west or the Atacama desert in Chile. But there the insolation is high, the sun shines for most of the year, and the winter days aren't short. But now, even in Denmark, solar has fallen to 5.4 cents per kWh. Remember that the capital cost of the solar panels and associated hardware has to be spread over much less sunshine. In winter the sun often doesn't shine, and when it does it's low in the sky. Yet despite this, solar in Denmark beats all other power sources except wind. Wind is still cheaper than solar--Danish wholesale prices are so low because of abundant wind resources. (Those hostile to renewables say that Danish electricity is expensive, but that's because it is taxed at the retail level. At wholesale, it's as cheap as the US.)
Denmark couldn't rely on solar alone, without significant seasonal storage, But it's a useful diversification of generating resources. And it shows just how cheap solar could be, even outside low latitude deserts. 10 degrees further south, say in Bordeaux or northern Italy, the cost of solar wouldn't be 5.4 cents/kWh. It would be less.
[Read more here]
Wednesday, December 14, 2016
Climate Stupidity
 |
| (Source) |
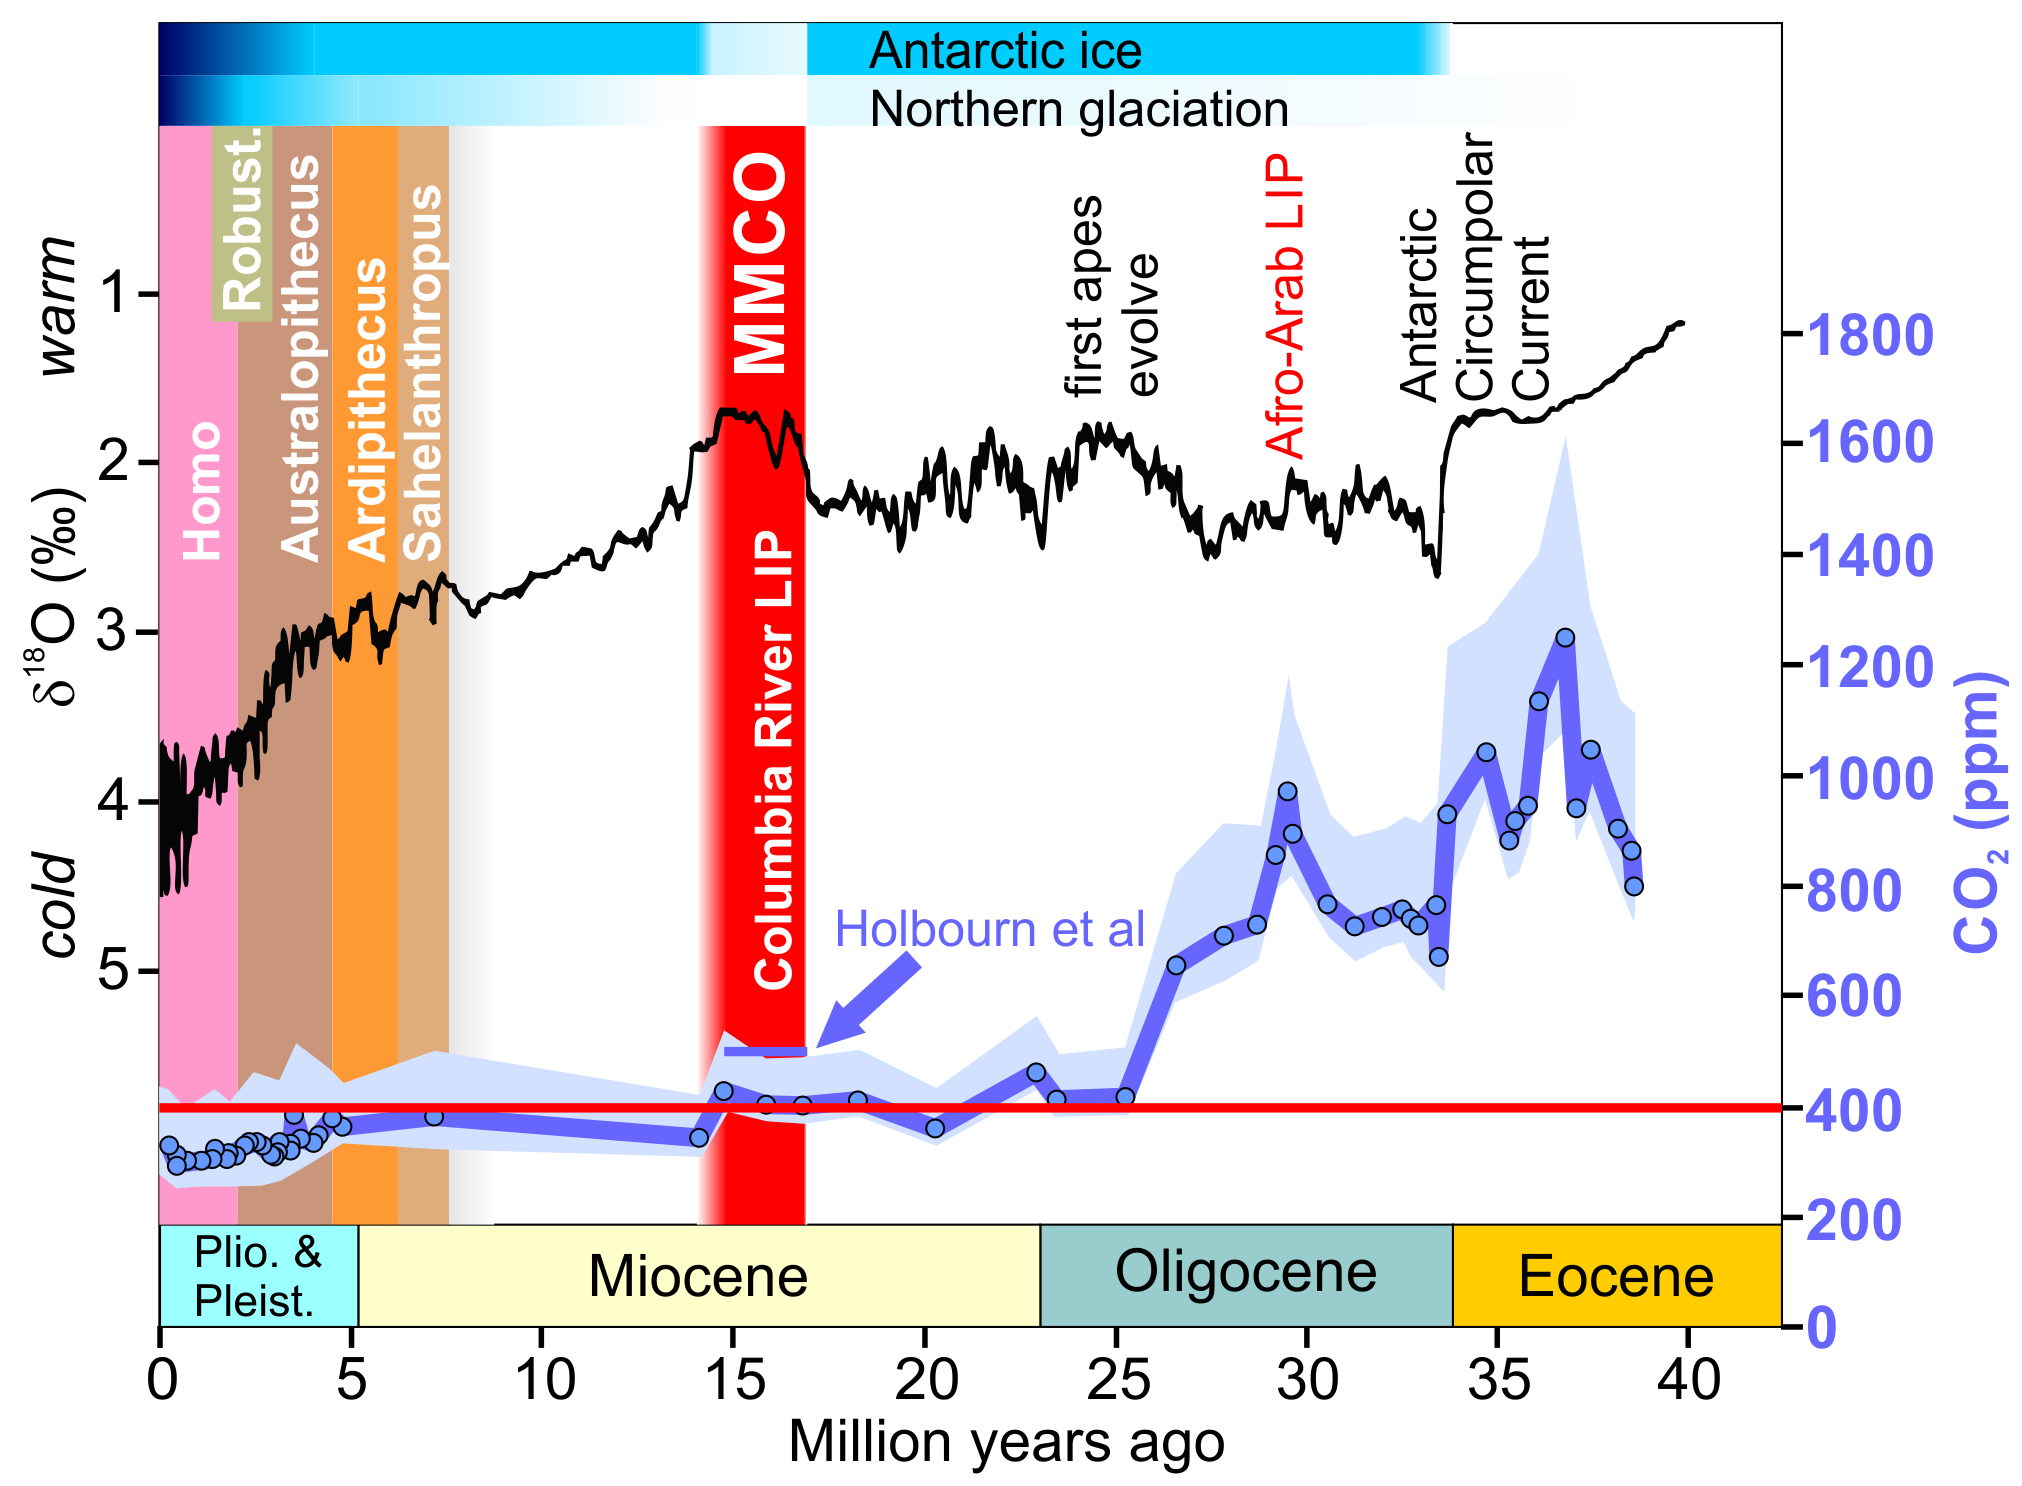
(15 million years ago, atmospheric CO2 levels in the range of 400-500 parts per million produced Antarctic melt resulting in substantial sea level rise. The above image shows the estimated location of the U.S. eastern coastline at the time. Image source: Colorado Geosystems.)
“The MMCO [Middle Miocene Climate Optimum] was
ushered in by CO2 levels jumping
abruptly from around 400ppm to 500 ppm, with global
temperatures warming by about 4°C and sea levels rising about 40m (130 feet) as
the Antarctic ice sheet declined substantially and suddenly. ” — Skeptical
Science
Human beings have never seen atmospheric CO2
values that are so high as they are today. They significantly predate our
species — even preceding our distant relative Australopithecus
by about 7 million years. And weather and climate conditions to which
we are not adapted — either as individuals or as a civilization — are well on
the way as atmospheric CO2 levels are ramping up into the lower range of those
last seen during the Middle Miocene of 14-16 million years ago at 404 parts per
million during 2016.
For the first 11 months of the year, 2016
atmospheric carbon dioxide concentrations exceeded those of 2015 by an average
of 3.45 parts per million. With no sign evident that the pace of increase has
slackened — despite a transition to La Nina during the fall — it now appears that the world
is set to experience a 3.3 to 3.5 part per million jump in the atmospheric CO2
measure for this year.
The past two record jumps were 2015 —
with a 3.05 ppm annual increase and 1998 with a 2.93 ppm annual increase. But 2016
now appears set to exceed these two values by a pretty hefty margin.
Such rapid rates of atmospheric carbon dioxide
increase are primarily caused by global fossil fuel burning — which now produces an emission that is more than 100
times greater than all the volcanoes that erupt across the Earth during any
given year. And recent reports have found that US automobile emissions alone equal the amount of
carbon dioxide emitted by the Mount St. Helens eruption every three days. This is a
heavy insult to the Earth’s climate system. One that is unprecedented for
millions of years.
[Read more here]
A 40 metres rise in sea levels, guys. 40 metres!
And yet there are still the Trumpistas living in their climate denialist
loony-tunes universe who want – Dear God! – to encourage the burning of fossil fuels.

Sunday, December 11, 2016
How much renewables do we have now?
I'm a data junkie. I want to know the facts. Whereas with economic data I have excellent resources, with data about renewables, the facts I can find are often contradictory. So in an earlier post this week, according to the Danish Energy Dept, renewables (including biomass) contributed 56% to Denmark's electricity generation. According to the chart below (from the Finkel Review into Oz's electricity market) Denmark is at 51% VRE (wind + solar), but you have to add biomass (about 11%) to that. The IEA's estimates for the current situation can probably be trusted, though their forecasts have been serially (and seriously) wrong for several years now. They have consistently underestimated the decline in the costs of wind and solar and therefore they have also completely missed the rise in deployment of wind and solar. My guess is that the forecasts for renewables for 2021 are again too low, though they are (now!) forecasting a doubling of the renewables percentage in the USA and China over the next 5 years. They are assuredly too low if we want to slow global warming.
 |
| (Source) |
Saturday, December 10, 2016

Record lows in sea ice
Global sea ice extent is way below previous lows. (Note (a) that this says nothing about ice on land, such as on the Antarctic or Greenland land mass and (b) Arctic and Antrarctic have different seasons--it's winter in the northern hemipshere and summer here in the southern)


Read more here
Read more here
Denmark: 56% of electricity from renewables
In 2015, Denmark produced 56% of its electricity from renewables:
(Note (a) that's not 56% of total energy demand, and (b) they're having no issues with grid stability)
[Read more here]

Higher electricity imports and much higher wind power generation led to a large drop in consumption of coal and other fossil fuels at power plants in 2015. This in turn meant that observed CO2 emissions fell by 6.6% in 2015, and that renewable energy now covers 56% of electricity consumption. These are headlines from Energy Statistics 2015, which were published by the Danish Energy Agency.
(Note (a) that's not 56% of total energy demand, and (b) they're having no issues with grid stability)
[Read more here]

Friday, December 9, 2016
Nuclear power not a solution
Here are just a few of the reasons nuclear won't work in Australia:
Currently available nuclear power plants are between 1 and 1.3GW.
and they don't like being trimmed much below 60% of peak output
particularly in the second half of the refuelling cycle.
and they don't like being trimmed much below 60% of peak output
particularly in the second half of the refuelling cycle.
Minimum demand in SA [South Australia] is around 600 MW and in most cases there will be some wind
running or solar or gas so the plant will need to find export demand for around
500-600 MW and on a windy night again competing with wind and sometimes finding
that there is not enough demand from Victoria or capacity on the interconnect.
running or solar or gas so the plant will need to find export demand for around
500-600 MW and on a windy night again competing with wind and sometimes finding
that there is not enough demand from Victoria or capacity on the interconnect.
To solve that problem, Japan and France have built a lot of pumped hydro (almost
60% of peak nuclear capacity in Japan) or interconnects to other markets. That
capacity can also be used to backup the plant in case of an outage. However, if
you only have one nuclear plant you must have backup equal to the peak capacity
so a 1.1 GW nuclear plant (AP1000) needs 1.1GW of fast acting capacity. i.e a
combination of gas spinning reserves and pumped hydro. Now pumped hydro is great
for a 4-5 hour shutdown but refuelling takes 4-6 weeks every 3 years so that
means all of the nuclear capacity has to be replaced by gas for that time.
There is another little trick to nuclear power. If the reactor is disconnected
by a SA style event [the once in 50 years storm recently, which brought down 19 transmission pylons] for 2-3 hours there is a built up of Xenon 135 which "poisons" the neutron flux and stops the reactor working. The Xenon-135 can take 25-35 hours to die down before the reactor can start up again. Then it can take another 30 hours or so to reach full power. Imagine how much money the gas
generators are going to make during that time
Now to the cost. In SA a nuclear plant might manage 75% utilisation while on
line (same as France) and therefore 72% allowing for refuelling, generating
around 7 TWh per year.
line (same as France) and therefore 72% allowing for refuelling, generating
around 7 TWh per year.
Plant Vogtle in the US is currently less than half complete, 40 months late
already after 5 years of construction and currently estimated at US$21b
including finance costs for two units, if there are no further delays.
We [in Australia] have no experience in nuclear building and none of the skills and heavy
welding, lifting equipment so we learn by doing or import a lot of expensive
French or American labour and we are only building one unit.
So less 15% for learning curve +20:30% for local costs +5% for seawater
cooling +10% for one unit not two so A$17.5b for one AP1000, plus storage + gas
backup and by the way it will take 10 years from permitting to full power. Then
add about $2-3b for the storage and $1.5-2.5b for a dual circuit interconnect to
the Sydney basin and using Pelican Point + Osbourne as the constantly running
"spinning reserve".
Permitting in the US and the UK where there are experienced regulators take 3-4
years. How are we going to do it quicker? So in total we can expect a 15 year
project from today.
years. How are we going to do it quicker? So in total we can expect a 15 year
project from today.
Operating costs for nuclear are pretty cheap, probably around US$25-35 per
MW.hr. say A$40 but at a generous 8.5% weighted average cost of capital and 45
year life, the interest and depreciation works out at A$278 per MWhr + $40
operating costs. Be generous and say $310. Forward prices in SA now for 2020 are
$83/MWhr so the proposed nuclear plant plus infrastructure would increase the
already high SA cost almost 4 times
With falling wind prices, $17.5b over 15 years can build about 10 GW of wind. As
the capacity factor is increasing with every new generation of turbines, we can
expect about 45 GWh of annual generation. Now even if we added 25% of that
amount of wind to the existing fleet we would already be generating all the
power SA needed from wind so again we need gas and extra storage. The advantage
is that even though one or even three wind wind farms could be taken off line by
a storm there would still be plenty generating so with 1GW of storage there
would be plenty of time to power up gas turbines from cold. Thus although there
might be more gas generation over the year, there would be very few times where
the generators are running "just in case" so overall gas costs would be lower.
We have operating costs for wind turbines at about $15/MW.hr and capital and
depreciation over 25 years at the same 8.5% so we are adding about 2.5GW of
wind at a cost of $4.5b, Lets say a new interconnect but because we don't have
the Xenon problem it doesn't need to be large or ro bust and leave the storage the
same. So now we have a total system of $4.5b + $1-1.5 interconnector + $2-3b for
storage say $8b generating about 11 TWhr. or $123/MW.hr with no subsidies i.e.
less than 40% of the cost of nuclear even including the excessive storage.
[From comment from reneweconomy.com.au, via a comment in The Guardian--Hat tip to summerswood. My minor edits in square brackets]
Paris Air Pollution

It's easy to worry about the rise of Trump and his Troglodytes. These antediluvian backward-looking idiots want to pull the US out of the Paris accord and reverse US moves towards combating climate change. And make no mistake, they will have some effect. Yet they can't and won't stop the revolution. It's simple: in electricity generation, renewables are cheaper than coal, and as cheap as gas. In transport, EVs (electric vehicles) are already cheaper to run than petrol- or diesel-driven cars, and soon -- by end 2017 -- will have similar sticker prices. Meanwhile, outside the demented Right in the US (and Australia), the reality of global warming is crystal clear. And so is the obviousness of other kinds of pollution created by particulate emissions from diesel and petrol cars. This episode of toxic air pollution in Paris shows why the switch to EVs won't stop. Several European countries plan to ban sales of new petrol-driven cars altogether within 10 years. My guesstimates are than within 15 years, nearly 100% of all new car and lorry sales in the US and Europe will be electric, Whatever the Troglodytes say or do.
Wednesday, December 7, 2016
Seasonal storage
 |
| (source) |
For places between latitudes 30 or 35 north and south, we only need to provide enough storage for one day (diurnal storage). Although there are seasonal fluctuations, the difference between winter and summer insolation is small or at least tolerable. Averaged out over thousands of locations, the supply of power is predictable. One day's worth of battery storage will cater for energy demands most of the time, with the batteries filled up between 9 and 3 and drained during the morning and afternoon peak.
And even one day's storage would be pricey. The Tesla Powerpack probably costs about $115/MWh now [Edit, 10/Dec 2016: I have probably overestimated the cost of Tesla batteries in my initial stab at estimating their LCOE because Tesla understates the actual capacity, in which case costs after this new decline are more like $70/MWh] , which means that if solar costs say $30 per MWh, adding just one day of storage increases the cost by 4 to 5 times, to the top end of coal. Battery costs are falling, so in 5 years, costs might have fallen by 2/3rds (let's be conservative!) and solar costs may well have halved so solar plus batteries would be about $65/MWh. Those costs assume an "island grid", a real island like Hawaii or a virtual island like Western Australia, where no power can be "borrowed" from other regions. If a region is part of a wider grid much less storage is needed. And the calcs also ignore that 2/3rds of power is consumed during the day. (The only reason the net demand peak has moved into the afternoon is because rooftop solar panels pump so much power into the grid at midday.) It also ignores that the big battery installers will initially be households with "behind the meter" storage, where the cost consideration is different, because they pay the (much higher) retail rates for electricity than the lower wholesale rates big users pay. But still, let that calc stand: $145/MWh now, probably falling to $65/MWh in 5 years.
Obviously, the further away you go from the equator, the less the insolation and the bigger the seasonal variance. At the extremes, within the arctic circle, there is no sun for 3 months of winter, while for 3 months over May/June/July there is sun for nearly 24 hours. In the high latitudes, solar can still be used for power in summer, but not for winter. And one day's solar storage wouldn't really be much use.
The good news is that at high latitudes wind is stronger and blows for longer. Hence the prevalence of wind rather than solar as a generating source in Scotland/Denmark/Northern Germany. And the wind blows all winter. Although from year to year the wind averages the same, it's possible (though rare) in high latitudes that there might be no wind for a week (the longest "no wind period" recorded in Denmark is 7 days.) And it is possible that there could be a cold spell, which could even--oh horror!--coincide with that wind-free period.
For this we need seasonal storage: storing power when the sun is strong and the wind high to provide for the winter dark. This isn't a problem now: many high latitude wind-dependent regions have reached 50% renewables without encountering problems with electricity supply in winter or with grid stability. But as the percentage from renewables rises this is going to become more difficult. Currently, we use gas peaking power plants to provide for times of high demand and low supply, but that means we are still using fossil fuels and are still emitting CO2.
Battery storage for such contingencies would be prodigiously expensive. For an "island grid", there would need to be at least one week of storage. The storage would cost 20 times the cost of the wind power alone.
But while we wait for battery costs to halve and halve again, there are two cheaper alternatives. One is concentrated solar power with storage. As the molten salts storage is integral to the system, the total cost of power production plus storage is cheap: below $80/MWh. But even here, building tanks to store molten salts for a week would add to the cost, though I have no idea how much. Producing power 24/7 is one thing; storing enough power for a week or more would be more costly. And anyway, for an "island grid" in high latitudes there just isn't enough sun in winter.
The other is power-to-gas. This is a shorthand phrase for producing hydrogen by electrolysis of water and either feeding the hydrogen into the gas grid directly or converting the hydrogen to methane using the Sabatier process and storing that. This synthetic methane is indistinguishable from natural gas. The sources I looked at proposed various limits on the percentage of hydrogen you could mix with methane from a conservative 5% to a generous 20%. Electrolysing just to hydrogen and not producing methane as an additional step means a slightly lower (8%) energy conversion loss and less capital expenditure, which would reduce costs, so the higher the hydrogen percentage feasible, the better.
Most developed countries have about 10 weeks of gas storage already, and a gas reticulation system. Adding power-to-gas to our energy system to provide for seasonal storage would be cheaper (for now) than using batteries. How much would it cost? According to this article, the energy loss going from electricity to gas and back again is about 65%. With co-generation (using the heat produced during the burning of the gas to heat buildings as well as produce electricity), it's only 50%. That means that the electricity produced from this power to gas would cost between 2 and 3 times the cost of wind electricity on its own. On the other hand, it would be needed only for say 4 weeks a year, with a four to six weeks reserve. That would increase the cost of wind by about 15%. However, you need a concentrated source of CO2 to produce the methane, and the best way to get that would be to capture and store the CO2 emitted when the methane is burnt. This would produce a closed cycle with no net CO2 emissions. The best estimate of costs I could find was a piece by the Global CCS institute (chart on page 9), which calculates the additional cost of carbon capture and storage for a gas combined-cycle generating plant as somewhere between $6 and $34/MWh. This increases the additional cost of power-to-gas to about 23% above the cost of wind alone (using the highest CCS estimate), for three weeks' storage. In other words, wind alone $30/MWh, but with 4 weeks power to gas storage, $30 +$7.1.
These are my guesstimates. I would be fascinated if any of you know of better data.
One final point. None of this is to be taken as arguing that we can't have renewables in our electricity grid. We can, and many countries have reached 50% from renewables without grid instability or power outages. But if we want to increase that percentage, storage will become essential. It will take us 15 or 20 years to get to 100% renewables, so we have time to plan just how we'll do it, while all the time, the costs of these new processes will fall. In the end, I suspect we'll use all of the techniques at our disposal: battery storage, CSP, power-to-gas, HVDC lines, and demand management.
Saturday, December 3, 2016
0.2 ℃ per decade
There are still people out there who say that there has been a pause in the rise in global temperatures. "Tamino" (who knows more about statistics than I've forgotten) looks at the data. His explanation is so clear even I can understand it. And the rise in temperatures since 1998 hasn't been much different from the rise before, roughly 0.2 ℃ per decade. In other words, no slowdown.
0.2 deg. C per decade is 1 ℃ every 50 years. And that's before powerful feedback mechanisms have got underway. For example, the "compost bomb" . Or the melting of methane clathrates. As I keep on pointing out, moving to replace all coal-fired electricity generation by renewables will not raise the price of electricity, it will not cause an economic collapse, it will not cause lower living standards. But not moving towards a green energy system surely will.
[Source of all charts]
Thursday, December 1, 2016
The world's largest solar farm

The world's largest solar plant has just been opened in India. It's in Tamil Nadu in the south, where insolation is high, but not as high as in inland Australia. It has a capacity of 648 MW (megawatts), and will produce annually 1/6th of the power of the new Westinghouse AP1000 nuclear reactor, the kind being installed at Plant Vogtle in Georgia, USA. Except that the solar farm took just 8 months to build, while a typical reactor will take 4 to 6 years (or longer--the new units at Plant Vogtle will take 7-8 years even without the planning and permitting stage), while leaving behind toxic by-products with a half-life of thousands of years. The project is comprised of 2.5 million individual solar modules, and cost $679m, or about $520K per MWh of annual output. By contrast, the Plant Vogtle's new units will cost $880 per MWh (annual output per unit 7900 MWh, cost $7 billion.) That's just the capital cost; running costs for solar would be very low because there is no fuel cost and maintenance costs for fixed array solar panels are negligible. [Read more here]
The Topaz Solar Farm in California produces 1,100 GWh of power per year and is a about 1/5th smaller than the Tamil Nadu plant. So a single solar farm the size of the Tamil Nadu one (remember Australia has solar resources better than India's or California's, so output should in fact be higher) would provide enough power for about 226,000 average Australian homes, as average per household electricity usage in Australia is 5817 kWh per year. Australia has 5,453,000 households, so 24 such farms, costing a total of about US $16 billion, would provide power for all of them. In practice, much of the PV capacity would be on rooftops of houses, schools, factories and shopping centres, not in solar farms. Residential consumption is 25% of total Australian electricity consumption. So for $60 billion, we could have 100% green electricity.
We will need storage for the evening and the morning peaks. The latest version of the Powerwall battery from Tesla stores 14 kWh per battery, and costs US$5500. So to provide the storage equivalent of one Powerwall per household, which would store a bit less than a household's daily demand, US$30 billion would be needed. However, although the Powerpack industrial-scale battery pricing hasn't been revealed, it will likely be about half the cost of the retail product. Which means for $30 billion half of our total daily demand from all sectors could be backed up by batteries.
Let's do it over the next 20 years. That amounts to US$4.5 billion a year, but progressively less in future years as solar and battery costs continue to fall. That's less that half a percent of GDP. And we would have to spend some of that money anyway, because our generating fleet of coal power stations is getting old and will need replacement.
I've ignored existing renewables, I haven't included the likely construction of several CSP (concentrated solar power with storage) plants, or the cost of new interconnectors between the eastern seaboard and South Australia with its rich wind resources. But the picture is clear enough. In twenty years we could reach 100% renewables for a tiny percentage of GDP.
The current Liberal-National government's policy is the utterly feeble Direct Action, which involves paying polluters not to pollute. The government spends its time denigrating any move towards renewables and telling lies about how much renewables would cost and how they would damage "energy security". They ask why we should do anything when India and China are not. But next year India will become the third biggest solar operator in the world, and despite having 7% a year growth in electricity demand, expects to produce 40% of its power from renewables by 2030. China is already by far the largest installer of wind and solar in the world, and for the last couple of years the growth in electricity demand has been more than supplied by renewables plus nuclear.
Subscribe to:
Posts (Atom)